Highlighting Area on Multiple Charts
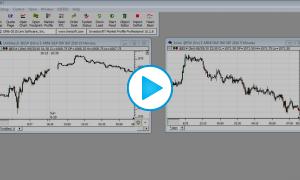
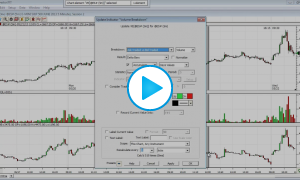
This video demonstrates how to highlight a rectangular region on one chart and have that same region (price range and date/time range) highlighted on other charts containing the same symbol.
This video demonstrates how to highlight a rectangular region on one chart and have that same region (price range and date/time range) highlighted on other charts containing the same symbol.
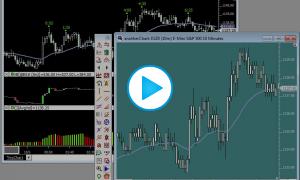
This video demonstrates how to quickly and easily move indicators from one chart to another while retaining the indicators settings.
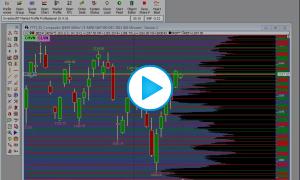
This video demonstrates how to duplicate FT71's composite and intraday charts and how to set them up properly for other symbols such as Crude Oil.

If you're in a situation where your data feed is active and your charts are static (frozen), try stepping through this checklist until your charts update properly.
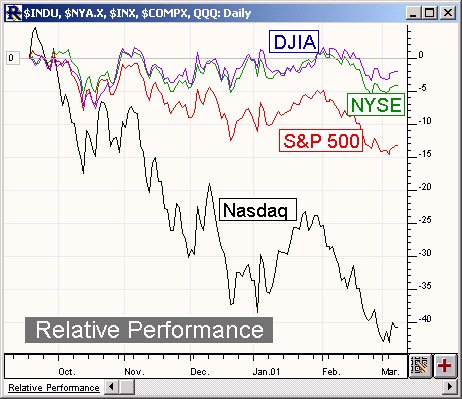
This trader's tip will discuss creating a Relative Performance Chart in Investor/RT as seen below ...

To create a Relative Performance Chart in Investor/RT, first choose from the main menu, "File: New: Chart". Specify the following settings for your new chart...

This video offers novice and intermediate level users of Investor/RT a tutorial on Multi-Pane Charts.
Here is a list of Topics covered along with the time within the video that the topic is covered:
See Also: Processing Data for Three Line Break Charts See Also: Three Line Break Preferences See Also: Three Line Break /Custom Columns Tutorial See Also: Three Line Break Technical Oscillator See Also: Three Line Break Technical In
See Also: Point and Figure Preferences See Also: Processing Data For Point and Figure Charts See Also: Renko Indicator
Related Renko Indicator Legacy Renko Charts
See Also: Raw Tick Chart Prefences
The Raw Tick Chart provides a new perspective for viewing real-time ticks in Investor/RT. The chart does not consider the time elapsed between ticks, but instead places each consecutive tick equal distance apart.
