charts

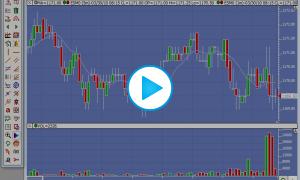
Charting Essentials: New Charts, Chart Templates, and Chart Shortcuts

Charting Essentials

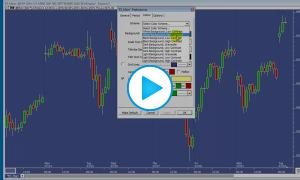
This video covers the essentials for creating and manipulating charts in Investor/RT. It's packed with essential tools and shortcuts for building and fine-tuning new charts and for using those fine-tuned charts as chart templates. Every Investor/RT user should become familiar with the information and shortcuts discussed in this short video.

Chart Element Manager

The chart Element Manager offers an easy way for users to Select, Edit, Reorder, or Delete MultiPane Chart Elements. To open it, right-click in a multi-pane chart and choose Element Manager or simply double-click inside the chart window to open the Chart Element Manager window. This window provides a list of graphic elements in the entire chart or in a specific pane based on your selection. When working with a specific pane, you may arrange the elements in drawing order. Using this window, you may select one or more elements and delete them.

Session Statistics Relative Volume

This chart demonstrates Investor/RT's ability to compare todays current volume in Black with the past Average Volume for that exact time period over the last 20 Days. The black histogram is simply a Volume Indicator showing the volume for each candlestick. The burgundy histogram is the average volume for that time period over the last 20 days. The green Histogram is the Relative percent (over or under) of Average.

Volume Profile Chart Style

Volume Profile Chart Style

This video demonstrates the Volume Profile charting style along with the ability for bars to load Volume at Price data, and how this positively impacts the VWAP, Profile, and Volume Breakdown Indicators.

Plotting Time-Sensitive Prices

Plotting Time-Sensitive Prices

This video below demonstrates how to plot reference lines on multi-pane charts for various key time-sensitive prices including the previous session close, the current day session open, the overnight high and low, the opening range (OR), initial balance (IB) and several IB multiples. These concepts can be used to plot a variety of similar time-sensitive prices on charts of any periodicity and any session. The video covers various concepts including user variables, custom columns, custom indicators, and reference lines.

Multi-Pane Charting Essentials

Multi-Pane Charting Essentials

This video discusses the important basic elements of traditional multi-pane charts including creating charts, changing the symbol or periodicity, and sharing charts.

Pages