Raw Tick Chart Preferences
Submitted by linnsoft on Tue, 04/23/2013 - 20:47
See Also: Raw Tick Charts

See Also: Raw Tick Charts
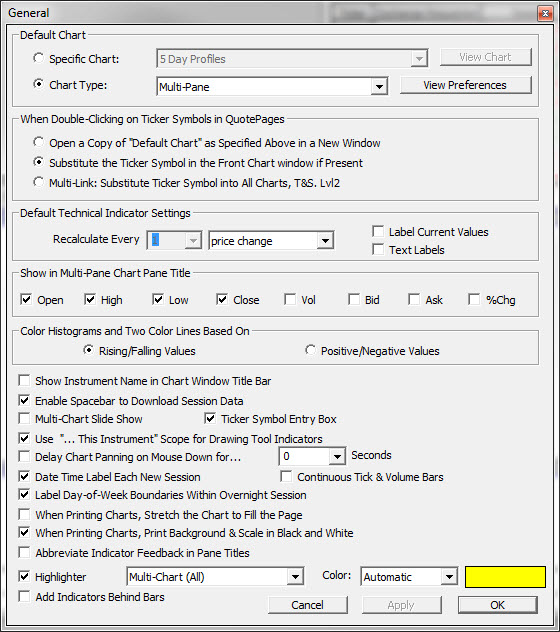
The charting preferences window allows the user to set default characteristics for new charts. Set default color for Chart Background, Chart Scale, Candle Colors, Bar Colors and Line Preference.

The Charts, General window, as seen below, is used to specify several advanced charting preference settings . . .
- The standalone Point and Figure charts have been largely replaced by the Point and Figure periodicity of Traditional Charts.
See Also: Point and Figure Preferences See Also: Processing Data For Point and Figure Charts See Also: Point And Figure Indicator
For line graphs, the price used to draw the line may be the open, high, low, last, the median of high and low , or the median of high, low, and last. A continuous line graph is simply a line drawn between each of the price points for the selected price type. A connected line adds dots at each price point. Line graphs may be drawn with one of three line thicknesses and in a user specified color.

See Also: Day Bar Preferences
The Chart Quotepage Wizard is a chart setup assistant that can create multiple chart displays from the list of instruments present in a quote page. The wizard can be opened from the File > Functions window, or by clicking the chart icon in the Quote Page toolbar when no particular row in the quote page is selected. After running a scan, for example, you can click the chart icon on the scan results quote page toolbar to quickly view an array of charts on the issues identified by the scan.
A bar shows a vertical line representing the high to low trading range for the bar. Tick marks on the left and right side of the vertical bar mark the open and closing price of the bar. Daily, weekly, and monthly bars are color coded with an up color or down color based on whether the closing price of the bar is higher or lower than the closing price of the prior bar.
