charts

Higher Close, Lower Volume

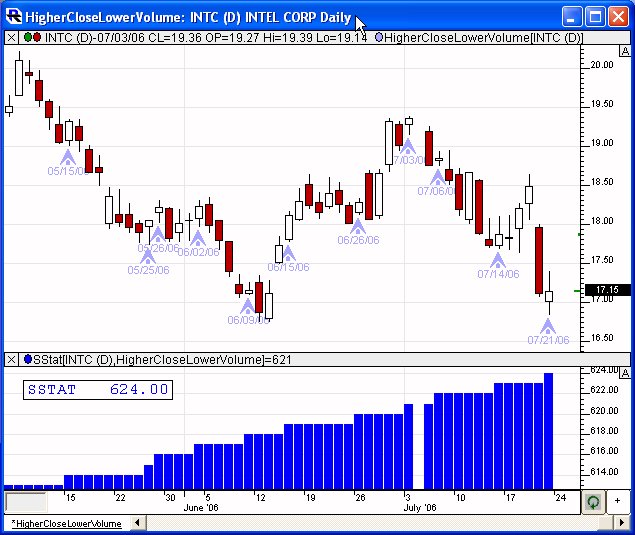
Higher Close, Lower Volume - This is a daily chart of INTC. The signals below the candles denote bars where the price closed higher than the previous day on lower volume. The lower pane shows how many days that has happened over the duration of the chart, which in this case, is 10 years.

Heiken Ashi

The Heiken-Ashi chart was discussed in the article Using the Heiken-Ashi Technique in the February 2004 issue of Stocks and Commodities Magazine (TASC).

Gap Adjusted Moving Average

This chart plots a gap-adjusted moving average in pink. This moving average is implemented with a custom indicator and therefore requires the pro version of Investor/RT. This is a 20 period simple average. Notice the red line meets up with the standard 20 period simple MA on the 20th bar of the session.

The syntax of the custom indicator follows:

Empirical Mode Decomposition

This chart shows the EMD indicator in the lower pane. The upper has signal markers showing when the Trend Component crossed above the Average Peaks (blue boxes) and below the Average Valleys (red boxes). This chart is reflects the indicators discussed in the article titled Empirical Mode Decomposition in the March 2010 Issue of Stocks and Commodities magazine, by John F. Ehlers and Ric Way.

Extreme Delta

This chart contains signal markers for buy (green) and sell (red) signals based on the delta turning positive after several down bars (buy) or turning negative after several up bars (sell). There are buttons to toggle both the 3-bar and 5-bar versions of this. The chart is shows the S&P emini with a 4 tick range bar.

DeMark Combo

This chart shows a variation of the DeMark Combo. The red markers at bottom of the chart represent condition 1 (CL<=LO3 AND CL<CL2 AND LO<LO2) and the blue markers represent condition 2 (CL < CL4). At the top, the gold marker represents Cond1 occurring 13 times over the recent period (30 bars), and the green bars represent Cond2 occurring 9 or more times in a row. The orange combo markers represent both of the previous conditions occuring in past 30 bars, along with the condition that the bar prior to first of the 9 consecutive Cond1 signals have the condition: CL > CL.4.

RTL Lesson - Initial Balance Multiples

RTL Lesson - Initial Balance Multiples

This video demonstrates how to add the Initial Balance as well as Initial Balance Multiples (IBH1.5, IBL2.0, etc) to multi-pane charts. It discusses how to add these both to day session and Globex session charts, as well as how to add to rangebar, volumebar, and tickbar charts.

Pages