Tips - Traditional Chart Shortcuts
This tip will cover some hidden features of Traditional Charts. Most of the tips involve shortcut keys for accessing certain charting features.
This tip will cover some hidden features of Traditional Charts. Most of the tips involve shortcut keys for accessing certain charting features.
This tip was taken from a question addressed to support via email. The tip touches on Chart Annotation, Default Charts, Layouts, and Multi-Link.
See also Point and Figure Charts
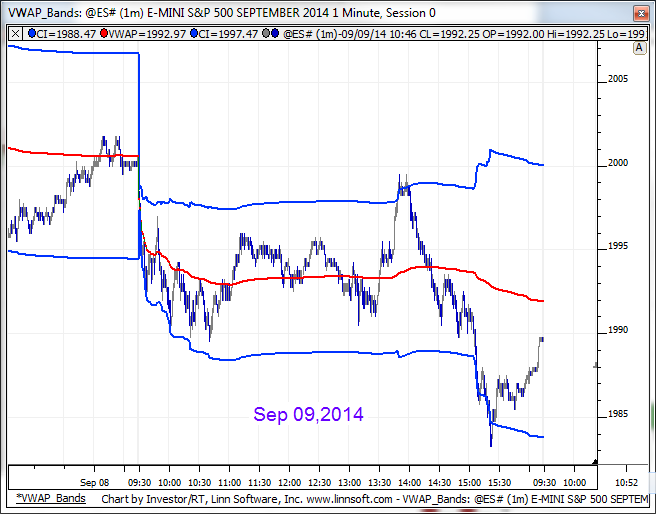
This chart draws VWAP bands (Volume Weighted Average Price) at the VWAP +/- half the current days range. As the days progresses and the range expands, the bands expand. The VWAP bands are commonly used as support (lower) and resistance (upper). NOTE: VWAP Bands are now built into the VWAP Indicator.
The system detailed below is discussed in the article "Trade The Price Swings" by Barbara Star, Ph. D, in the December 2003 issue of Technical Analysis of Stocks and Commodities Magazine.
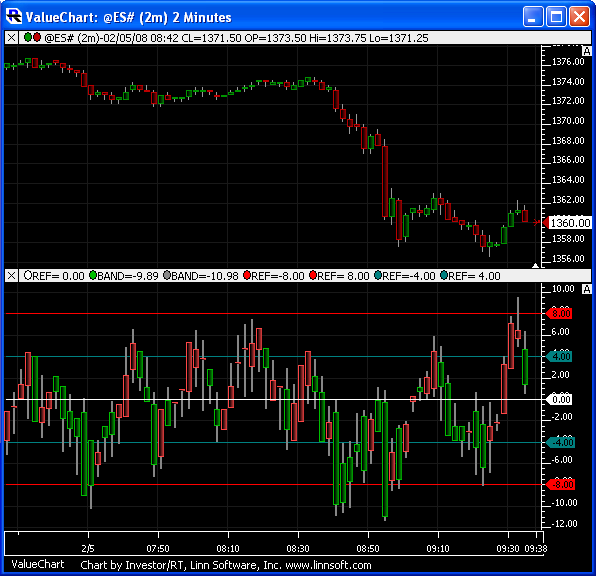
Value Chart - This chart shows the Value Chart / Value Indicator in the lower pane on a 2-minute chart of the ES with reference lines at key levels of -8, -4, 0, 4, and 8.
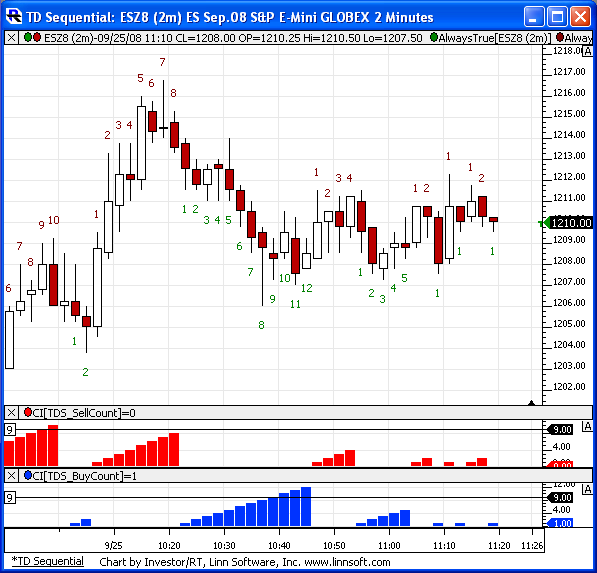
TD Sequential Chart - (Pro Required) This chart shows the TD Sequential Count above and below the bars. The red numbers above the bars count the consecutive bars in which close is above the close four bars back (9 or greater for a sell setup). The green numbers below the bars count the consecutive bars in which close is below the close four bars back (9 or greater for a buy setup).
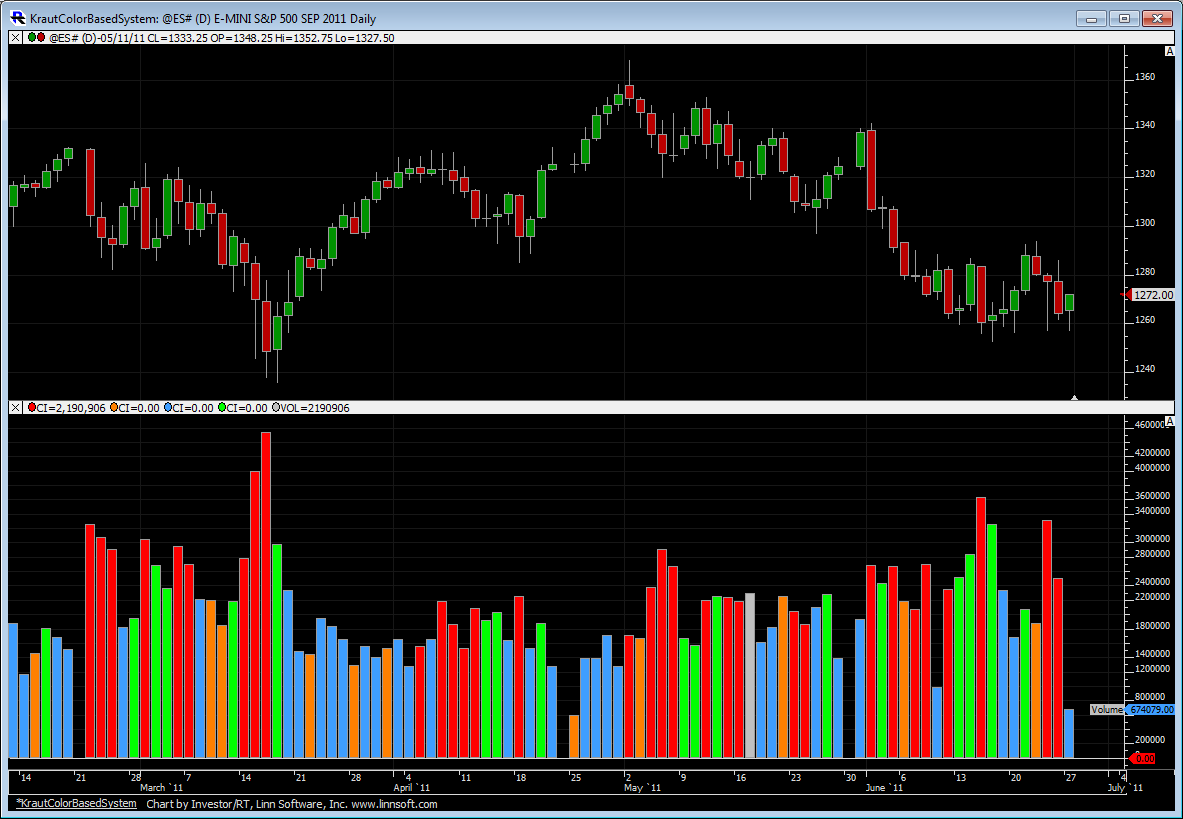
This chart contains the Kraut Color-Based system for short term trading, discussed in the Trader's Tips section of the July 2011 issue of TASC magazine. Volume bars are painted as follows.
If today's close and volume are greater than 2 weeks ago, color green
If today's close is greater and volume is less than 2 weeks ago, color blue
If today's close and volume are less than 2 weeks ago, color orange
If today's close is less and volume is greater than 2 weeks ago, color red
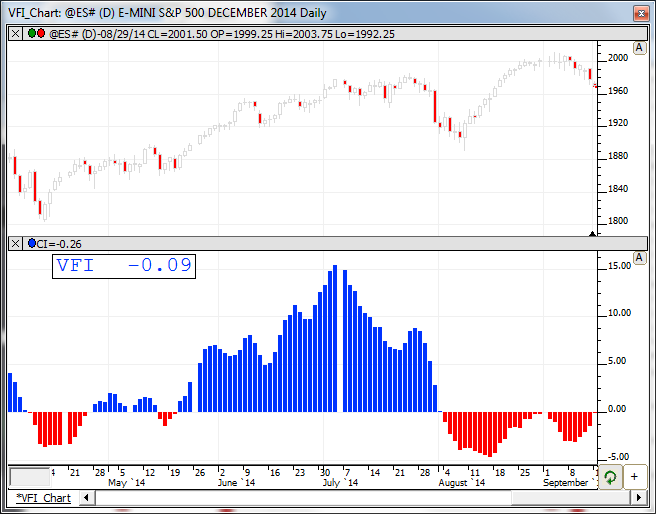
This chart contains the Volume Flow Index (VFI) custom indicator discussed in the Trader's Tips section of the June 2004 issue of TASC magazine.
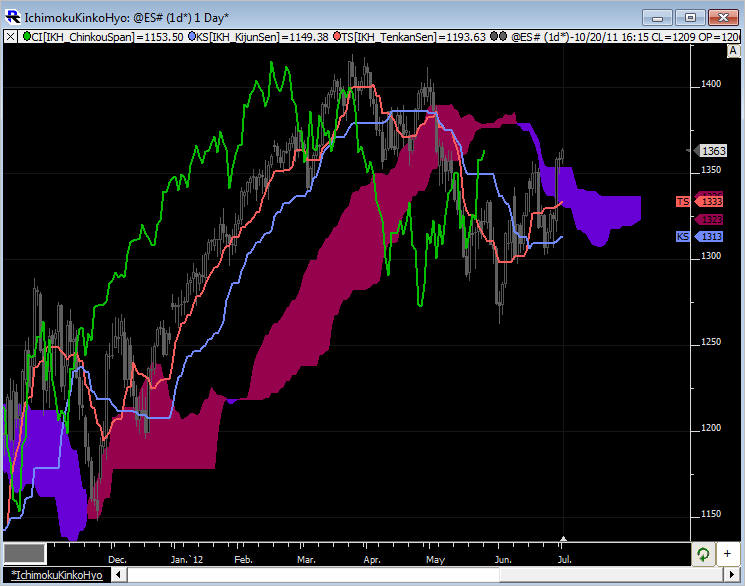
Ichimoku Kinko Hyo Chart Definition