features

Numeric Constants and Flags

Numeric constants and flags are simply tokens which represent constant numbers. They exist to facilitate equation composition. The descriptive tokens are generally easier to remember than the numbers they represent.

Optimization of Trading Systems Realization

The Realization feature in Investor/RT refers to the process of walk-forward out-of-sample testing (or walk-forward optimization). In essence, Investor/RT optimizes (or backtests) over a given period, then tests using the optimized variables (or best performing symbols, or both) over a subsequent period immediately following the optimization period. In this way, we are seeing historically what we could have achieved in reality by trading our optimized results or best performing symbols.

Raw Tick Charts

See Also: Raw Tick Chart Prefences

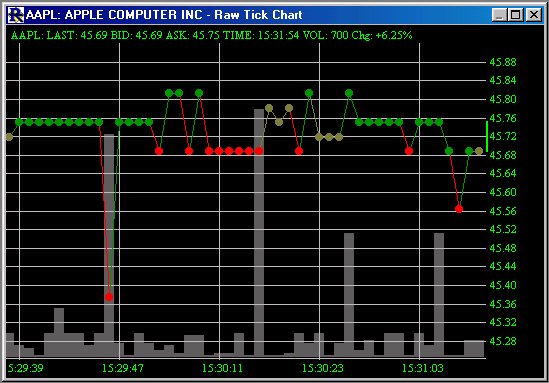
The Raw Tick Chart provides a new perspective for viewing real-time ticks in Investor/RT. The chart does not consider the time elapsed between ticks, but instead places each consecutive tick equal distance apart.

rawtick

Quick Quote

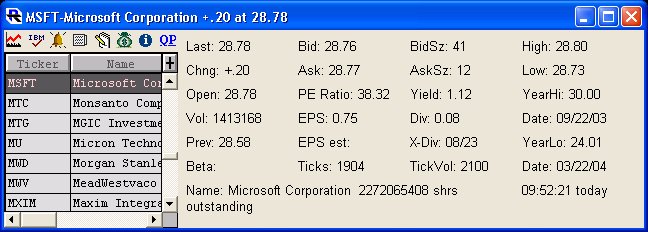
A Quick Quote window displays a detailed summary of all current information available for each symbol in Investor/RT. To choose a particular instrument, type letters on the keyboard, or use the mouse to scroll the list and click on an instrument.

qqWindow

The Quick Quote window is useful for accessing all kinds of information related to a particular instrument. Icon buttons in the window provide access to:

Quote Page Column Headings

Investor/RT maintains more than 100 data items for each instrument, depending on the data service in use. A quote page may display up to 30 of these data items at one time as columns in the spreadsheet. To make it convenient to switch quote pages from one set of data columns to another, Investor/RT allows the user to define quote page formats. A format is simply a list of column identifiers in the left to right sequence in which they will appear across the quote page. Each format has a name to identify it. Investor/RT has 12 built-in formats that serve as samples.

Printing

Objects may be printed by clicking on the Print icon or by choosing File:Print.

The following objects may be printed:

  • Charts
  • Point and Figure Charts
  • Quote Pages
  • Portfolios
  • Text Windows
  • News Browsers
  • Trading Notes

Technical Indicator Presets

The Preset Popup Button The preset popup button can be found at the bottom of all technical indicator preference windows. Clicking on the button initiates a popup window as seen below.

presets

Pages