features

Regression Review

The following is a brief review of the Regression studies looked at during an intensive session over the course of 4 days.

Formula Tokens

Below is a list of the tokens used in the Technical Indicator Formulas, along with a description of what these tokens represent.

Setting Preferences

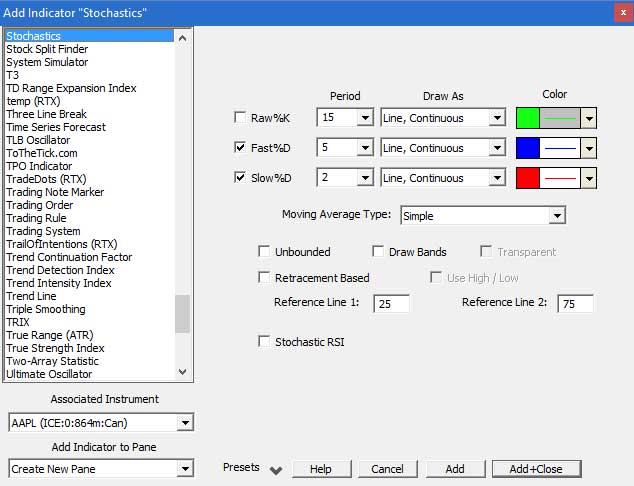
Click on the preference topic from the list below to view a screenshot of the actual preference window along with information about the options in that window.

Technical Indicator Scope

Prior to Version 5.2, every technical indicator added to a chart is specific to that chart window. Every chart window in Investor/RT is a "template". That is, you can switch a different instrument into any chart and all of the technical indicators within the chart are automatically associated with the new instrument. In Version 5.2 we have considerably expanded the flexibility of technical indicators by enabling them to be designated either as "instrument specific indicators" or "all chart indicators" (or both).

Schedules

The Schedule Setup Window

Scans, Trading Signals, Custom Indicators Special Functions

Function Description Example
SQRT(X) Square Root of X SQRT(HI _ LO)
ABS(X) Absolute Value of X ABS(CL - CL1)
MIN(X,Y) Minimum Value of X during the preceding Y periods MIN(RSI, 5)
MAX(X,Y) Maximum Value of X during the preceding Y periods MAX((HI4 - LO), 8)
AVG(X,Y)

Operators - Arithmetic, Relational, Logical

Operators - Arithmetic, Relational, Logical

Arithmetic Description Example
+ Addition HI + LO + CL
- Subtraction MA - CL
* Multiplication (CL * 2 + MA * 3) / 5
/ Division (HI + LO + CL) / 3
% Remainder operator. X % Y results in the remainder of X / Y. For instance, 10%3 = 1.

Pages