

support

How do I know when new versions of Investor/RT are available?

Visit the  Download Center for the most recent version of Investor/RT.

Setup > Preferences > Mail and Internet has a Check for Updates check box; when checked, Investor/RT will notify you at start up when a new release of the software is available and offer to download it. If you elect to turn off the automatic checking, you can check manually from time to time by choosing Check for Updates from the Investor/RT Help Menu.
I would like to be able to optimize column widths in Portfolios but, I would like to have the preference set for actual data rather than column headings as sometimes the column headings are substantially larger than the data.

This capability has been available in the portfolio for a long time. It was not implemented with an explicit user option in the portfolio preferences however, like it is in the quotepage preferences. When you right-click on any column in a portfolio and choose Optimize Column Widths you get the effect of Size to Show Full Column Title as you have discovered. If you want "Size to Show First Word of Title" then hold down the shift key while making the "Optimize..." menu selection.

What is Presentation Mode?

When Investor/RT is operating in Presentation Mode, certain graphical objects, like candlestick bodies, histograms, custom profiles, and Renko chart boxes, are drawn with a shading effect. While this mode can be more aesthetically pleasing, it is not generally recommended for continuous use. Drawing objects in this mode is more processor intensive. You may want to limit use of this feature to creating screenshots, or when reviewing charts after market hours.

Restore Points

Hardware failure, virus infection, stolen computer : be prepared !

Ensure you regularly (once a week) maintain a recent restore point on the cloud or on a separate drive. This way, you could quickly move your database to another PC and keep using Investor/RT

Downloading and Retaining Data

Investor/RT's automatic backfill is designed to keep daily and intra-day historical data up to date automatically without user involvement. Generally speaking, if you track fewer than 100 symbols, all historical data management should simply be done for you; there should not be a need to manually perform data downloading operations.

Users who track many hundreds or thousands of symbols are exceptional cases where a higher degree of user involvement is required to keep your historical data current.

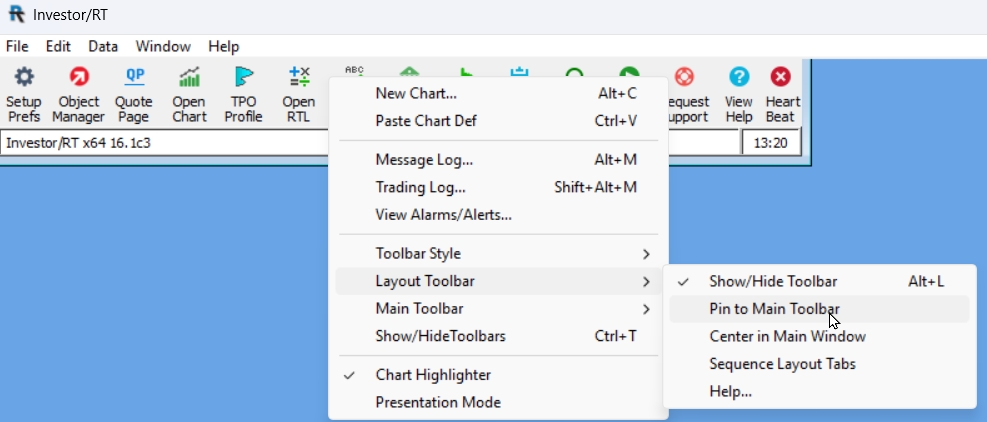
My layout toolbar has disappeared. How do I get it back?

Right-click inside the message area of the main toolbar (the white horizontal section with Investor/RT x64 16.1) and access the Layout Toolbar submenu. You can choose to pin the toolbar to the right of the main toolbar, or bring the toolbar to the center of the screen. Once the layout toolbar is visible, you may, of course, reposition it as desired by dragging it with the mouse.

Why are all Windows Floating?

By design Investor/RT does not have minimize, maximize, restore buttons on the title bar, only the close button. Multipane charts typically have Minimize, Maximize and restore button available at the top right section of the button pane (see more details below). For other windows type, right-clicking in the title bar usually offers a menu of choices for Minimize, Maximize and Restore actions (with the Alt - keyboard combination also minimizing any selected window). All windows, charts, quote pages, preferences windows, object manager, etc. are floating windows.

Using DDE links to get data from Investor/RT

MS Windows Spreadsheet Linking using DDE

Investor/RT for MS Windows uses DDE (Dynamic Data Exchange) to provide market data to other applications such as

  • Microsoft Excel
  • OpenOffice Calc, the spreadsheet component of the OpenOffice software suite

In order to create a link in your spreadsheet, you type a formula into a cell. The formula specifies the ticker symbol and the name of the data item you want Investor/RT to place there. The cell formula formats are the following :

Object Manager

The Object Manager is an essential tool in Investor/RT. Understanding its role is important for new users.. Please take the time to review this article thoroughly and familiarize yourself with the Object Manager as this feature is critical to your success with Investor/RT. The Object Manger serves as a "central hub" in Investor/RT to mainipulate (Open, Edit, Delete, etc.) most of the elements within the program. It serves as a "Jumping off" or starting point to reach amost any Object including the following:

Backfill Automation

Investor/RT automated backfill mode has 2 purposes

  • at startup, it is designed to backfill historical data since the date/time that the data feed was last stopped.  
  • It is also designed to fill in any historical data per symbol (tagged for intraday monitoring) for all trading that has occurred since the last trade recorded in the local database.

Pages