Audible Alert Every 30 Minutes During Session
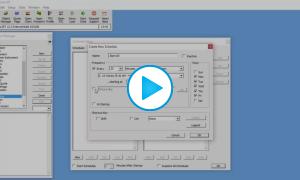
In this video tip, Chad Payne explains how to setup Investor/RT to play an audible alert every 30 minutes throughout the regular trading session using the Schedule module.
In this video tip, Chad Payne explains how to setup Investor/RT to play an audible alert every 30 minutes throughout the regular trading session using the Schedule module.


How to paint or shade background of the overnight period (or day session) a diferent color.

How to access the overnight volume point of control (ON VPOC) on a day session chart.

How to access the various prices (high, low, open, close) of the cumulative delta bars available in the Volume Breakdown indicator, specifically for use within Signals or Custom Indicators (RTL).

To plot the overnight high and/or low on a day session chart (of any periodicity), you'll use a combination of Mixed Periodicity Data (MPD) and Session Statistics (SESST). MPD will allow you to mix sessions so you can access the full session (31) data and then SESST can take that data and compute the high and low of the overnight period. So add MPD to the chart, with these settings:
A configuration variable (File: Preferences: ConfiguratIon) titled RangeBarAltMethod controls how range bars are formed. By default, RangeBarAltMethod is False and as such, range bars will continue to form until price breaks out of the specified range. For instance, for a 4 tick range bar, the bar will continue to form until the range becomes 4 ticks, and it will continue to form beyond that until the first tick in which price trades outside the range. That tick will be the first tick of a new bar. So essentially, price must trade outside the range specified to begin a new bar. The ope
This video provides some tips on switching between feeds, and will be especially valuable for futures traders (for whom the symbols are different between feeds).
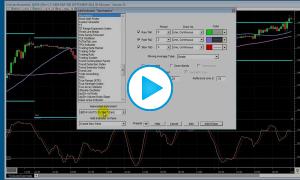
This video demonstrates how to add, edit, delete, and manipulate technical indicators in Investor/RT. This video is especially valuable for new users but experienced users may also pick up a few new tools and shortcuts in this short video.
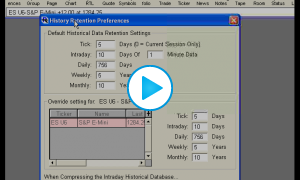
This video covers techniques to manage your data mostly focusing on intra-day data and tick data. This is an important concept in Investor/RT. If you keep your historical data to a minimum, the program will run much more efficiently.