tutorials

Tutorial - Creating Your Custom Trading System

appleOneMinChart

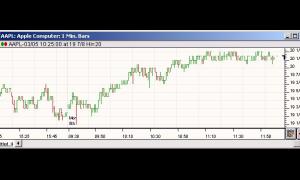
The first decision you must make when building your trading system is what bag of securities you would like to monitor, study, and ultimately trade. This is a very important decision and not necessarily an easy one. Will you be tracking the Nasdaq 100, the Dow 30, the E-Mini, S&P Futures, Microsoft Options? The choice is up to you. If you haven't made this decision yet, then maybe you have some more research to do before proceeding. In our example, we'll track the Nasdaq 100.

Tutorial - Colored Histograms - Coloring Extreme Levels

coloredHist

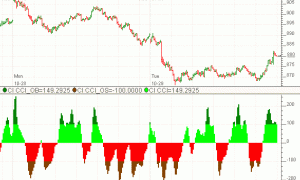
This Tutorial will demonstrate how to color extreme levels of histograms, as seen in the chart above. It will cover the following topics.

  • Creating custom indicators that represent different levels of an oscillator
  • Overlaying three custom indicators in one chart pane
  • Adjusting the order of elements in a chart pane

Tutorial - Custom Columns - Linear Regression Bands

cc_lrf_clip

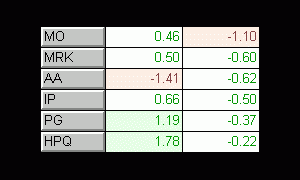
This tutorial will demonstrate how to quickly add Custom Columns to a quotepage which, in this instance, displays the distance (in standard deviations) of the current price from the linear regression (best fit) line of the past 20 bars. This tutorial will make use of the Technical Indicator "Linear Regression Forecast", but can be generalized to use any of the built-in technical indicators, as well as any custom indicator, scan, trading signal, or built-in quotepage column. You could use this same concept to dynamically show....the distance of current price from the 30 day moving average...the value of the 13-minute CCI with background of cell green when above 100, red when below -100....the 60 minute or 60 day percent change...a moving average crossover on the previous 5-minute bar....the total number of 5-minute up-bars in the current trading session...the total volume of the first 30-minutes of trading for current session....and on and on.

Tutorial - Monitoring Data 'Completeness'

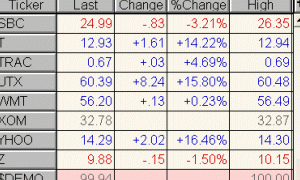
This Tutorial will demonstrate how to create two custom columns that will allow the user to quickly identify any holes in daily or intraday data. In our particular case, we are going to look at the last 100 daily and intraday bars, and see how many are missing. If you would prefer to check more (200, 300) or less (50, etc), just change the 100 to whatever number you choose throughout the tutorial.

First, create the a custom indicator with the following simple syntax:

BARS

Pages