Duration:01:01:13
Variable speed version:
Watch
This video takes a comprehensive look at the many features and applications of the Profile Indicator to implement time and volume-profiles of any duration.
Video timeline
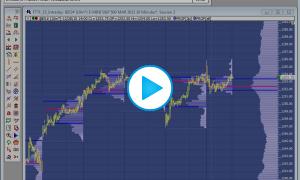
- Introduction and Overview - What this video will be working towards, including images of the charts we will create during video
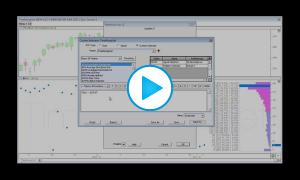
- Chart Setup - How to optimally setup a charts colors, bars, etc, for use with the Profile Indicator.
- Adding Profiles - Several different ways to add the Profile Indicator to a chart.
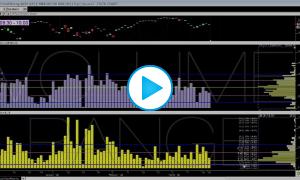
- Volume or Time - Basing the Profile Indicator on Price and Volume or Price and Time.
- Volume at Price - How volume is distributed among prices. How tick data and one minute data is distributed.
- Profile Duration - Various options for the amount of time covered in each profile. Single profiles versus multiple profiles.
- POC / Value Area - Options for displaying the current and/or previous value area and point of control.
- Drawing Options - Options for what style is used for drawing the profiles, including hollogram, volume profile, lines, blocks, and more.
- Naked Lines - Extended naked POCs, highs, lows, or closes.
- Peaks/Valleys - High volume and low volume nodes.
- Miscellaneous - Review of several lesser used options of the Profile Indicator.
Additional Notes
The Profile Indicator requires the TPO Profile version of Investor/RT. Upgrading to TPO Profile is quick and easy from your account page Profile Indicator data can be easily exported to a text file which is formatted nicely for Excel. Right-click on the dotted rectangle around the Profile and choose "Export Data". You'll get something similar to this for every profile.