Other

Fractals - Swing Highs, Swing Lows

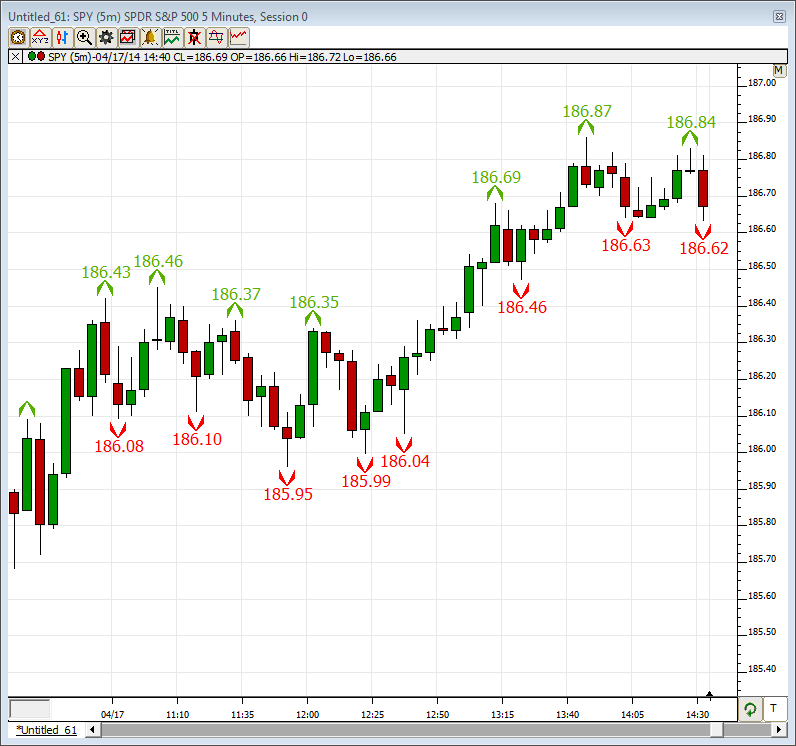
The Investor/RT Fractal indicator is based upon the "Bill Williams Fractal" in the book "Trading Chaos" by Bill Williams, PhD. A fractal is an entry technique that is traditionally defined as "a bar that has two preceding and two following bars with lower highs (or lower lows, on a down move)". Several different varieties of up and down bar 5-bar fractal formations can be seen below.

fractals

Fisher Transform (FISH)

Fisher Transform (FISH) is based on the article "Using The Fisher Transform" by John Ehlers that will be available in the November 2002 issue of Stocks and Commodities Magazine. FISH has sharp and distinct turning points that occur in a timely fashion. It is based on the assumption that prices do not have a Gaussian probability density function (PDF), but you can create a nearly Gaussian PDF for prices by normalizing price, or an indicator such as RSI, and applying the Fisher Transform. The resulting peak swings clearly identify price reversals.

Empirical Decomposition Mode Indicator

The Empirical Mode Decomposition Indicator (EMD) helps identify whether a market is in a cycle or trend mode. This indicator is discussed in the article titled "Empirical Mode Decomposition" in the March 2010 Issue of Stocks and Commodities magazine, by John F. Ehlers and Ric Way. According to the article, when the Trend Component rises above the Average Peaks, the market is in an uptrend, when it is below the Average Valleys, the market is in a downtrend, and when it's between the two, the market is in cycle mode.

Directional Indicator (DIPLUS, DIMINUS)

The Directional Indicator is a momentum indicator which attempts to quantify the trending or directional behavior of a market. It is one of the best trend following indicator in technical analysis. It helps identify trends and whether or not price is moving quickly enough to be worth a long or short play. It also helps traders take a nice profit out of the middle of significant trends. Directional Indicator is defined as the largest part of the current period price range which lies outside the previous period price range.

Data Validation

The Data Validation Technical Indicator is a legacy charting or scan indicator that inspects the data for some instrument and looks for exceptional conditions. The data validation indicator when used in a chart window has an option to remove any data bars or ticks having a price that is outside some user specified acceptable range. This indicator is rarely if ever needed at present. At one time, it filled an important need when real-time data streaming and historical data services were less reliable and thus correction of invalid data points was sometimes needed.

Candlestick Pattern Recognition (CPR)

The candlestick pattern recognition indicator tests for any of 41 candlestick patterns of interest. When adding the indicator to a chart, choose as many patterns as you like from the list of available patterns. Other parameters include three values used by the indicator to perform the pattern matching.

QuoteBoard Indicator

The QuoteBoard Indicator displays quotes, customized price levels, and daily bars on any symbol or group of symbols within a multi-pane chart. The symbols can be automatically sorted based on various performance measures and the custom prices within each symbol, which might include pivots, MP levels, and more, can be automatically sorted so users may dynamically see where each level is relative to current price.

Pages