Other

Chart Buttons

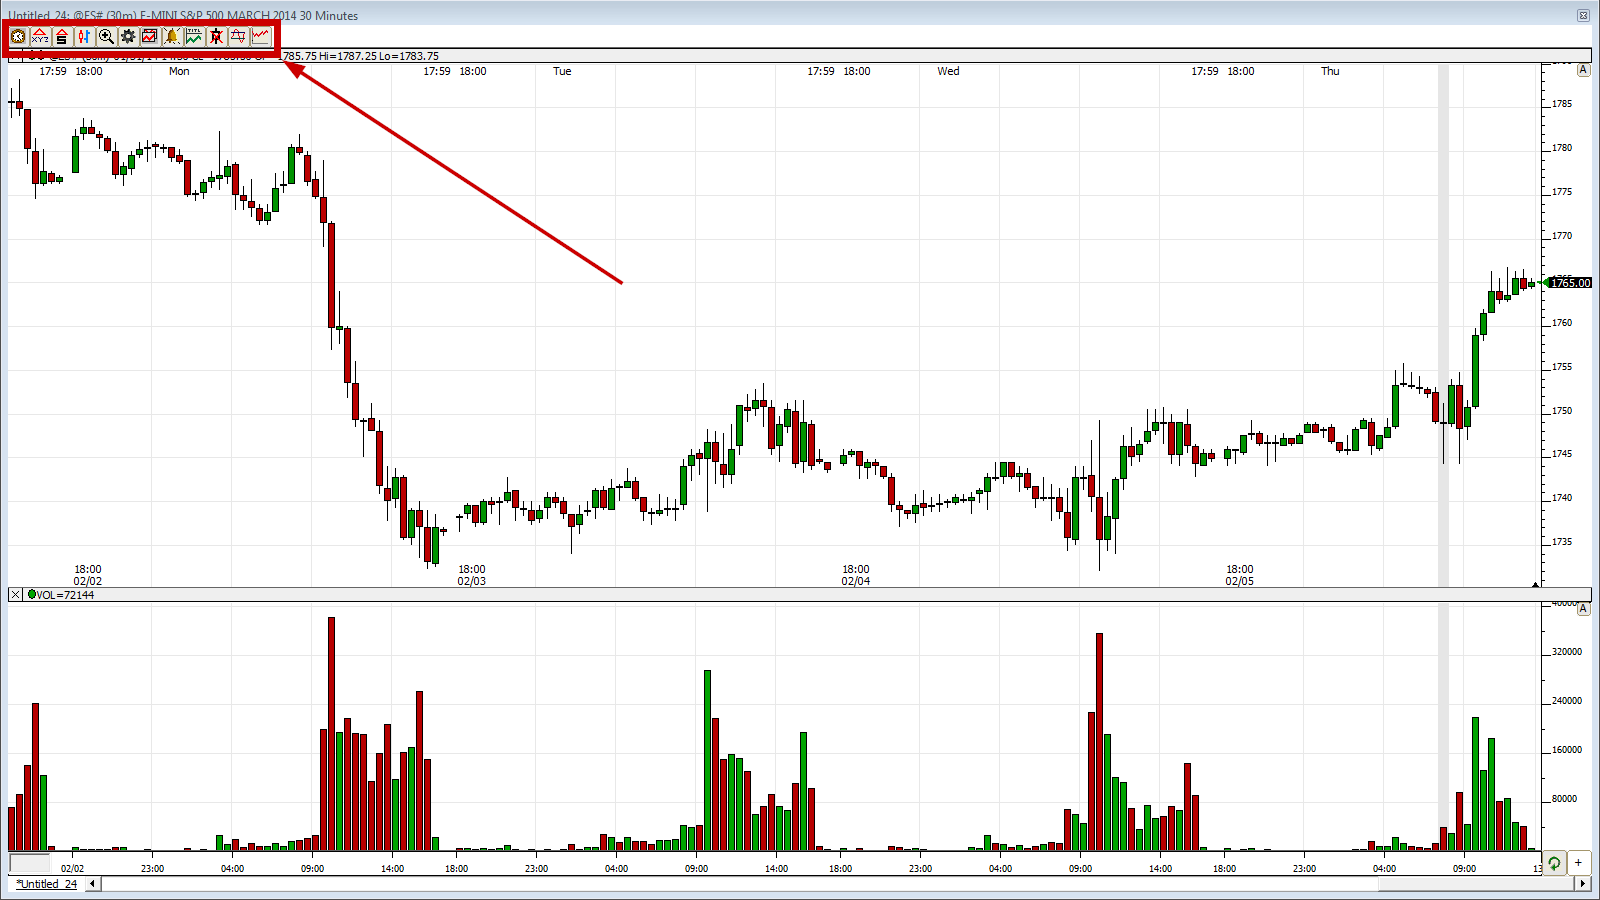
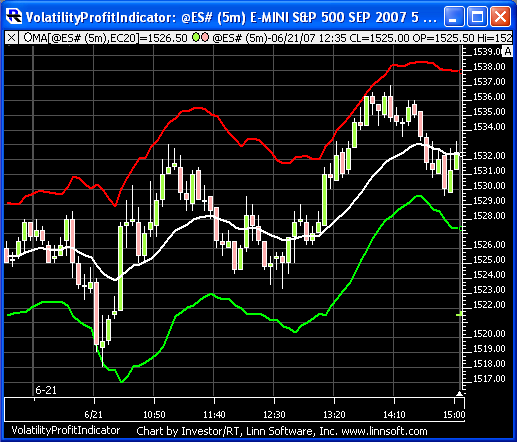
Chart Buttons enable you to add push buttons or menu buttons to any chart window to perform a variety of actions as shown in the image below. Buttons can be added to any pane of any chart just as you would add any indicator. If you have a series of button indicators that you wish to appear in every chart, set the scope of the button to "All Charts, Any Instrument" at the bottom of the Button Preferences window. From that point forward, any chart you open or create in the future will have the these ticker and periodicity buttons.

Zig Zag Oscillator Indicator (ZZO)

The Zig Zag Oscillator indicator provides a way of viewing the Zig Zag Indicator information in a different form, oscillating about 0. The indicator represents the percent change at each bar of the current price from the base price of the current Zig Zag leg. When the Zig Zag is currently in an uptrend state, the Zig Zag Oscillator will be above 0. Similarly, when the Zig Zag is in a downtrend state, the oscillator will be below 0. Optionally, reference lines may be drawn at any percent change level.

Williams Accumulation/Distribution (WAD)

This indicator measures market pressure by comparing the relationship between Closing price and daily range to quantify accumulation, or buying pressure, and distribution, or selling pressure. The indicator is calculated as follows: When current close is higher than the previous close, AD increases by current Close minus minimum (Current Low or Previous Close). When current Close is lower than the previous Close, AD decreases by maximum (Current High or Previous Close). Look for divergence of William's AD and price. Rising prices and falling AD can indicate a selling opportunity.

Volatility Stop (VSTOP)

The Volatility Stop Indicator helps define the current trend. The indicator plots a red line above the prices bars when a downward trend is detected, and a blue line below the bars when an upward trend is detected. These lines are commonly used as trailing stops. This indicator is commonly used as a exit tool rather than an entry technique. When price crosses the VSTOP value, the trend reverses and VSTOP moves to the other side of price. The VSTOP calculation method can be found above.

Long... CL > VSTOP AND CL.1 <= VSTOP

Volatility Profit Indicator (VPIH, VPIL)

The Volatility Profit Indicator had it's origins in a February 2005 Article in TASC titled "The Truth About Volatility" by Jim Berg. This article was geared toward longer term (weekly) charts, but has been found to work equally well for shorter term trading on intraday charts. The high band is computed by taking a moving average of the highs and adding a multiple of the average true range. The lower band is computed by taking a moving average of the lows and subtracting a multiple of the average true range.

Value Area Indicator (VAU, VAD)

The Value Area Indicator provides an automated band representing the volume-weighted Value Area. The Value Area bands represent the prices between which a certain percent of the volume was traded. The Value Area preferences have a setting for "Standard Deviations". A standard deviation setting of 1 will result in bands containing 68% of the volume. A standard deviation of 2 will result in bands containing 95% of the volume. The Value Area is of special interest to TPO Profile users, and will give these users a way to depict this Value Area on a chart.

Ultimate Oscillator (ULT)

The Ultimate Oscillator was designed by Larry Williams in an attempt to improve on the premature buy and sell signals he observed in other available oscillators. It is documented in the April, 1985 issue of Technical Analysis of Stocks & Commodities. The calculation of the oscillator can be seen above. The Ultimate Oscillator combines three oscillators that represent short-, intermediate- and long-term market cycles (7-, 14-, & 28-periods are recommended). Mr.

Up/Down Volume Ratio Slope (UDVRS)

Although the U/D Ratio is a powerful indicator, it is actually the change or slope of this ratio that signals a change in the stock price trend. If the slope of the U/D Ratio over n periods is increasing, the price of the stock is increasing on greater volume. Even better, if the slope of the U/D Ratio changes from negative (downward sloping) to positive (upward sloping), then enough buying action is coming into the stock to reverse the downward trend in the ratio.

Up/Down Volume Ratio (UDVR)

The Up/Down Volume ratio compares the representation of buyers vs. sellers over a period of time. The assumption is that if a stock closes UP for the day, the attributable volume was induced by buying pressure and thus the stock is under accumulation. Conversely, if a stock closes DOWN for the day, the trading activity is deemed to be selling induced, a sign of distribution. Up/Down ratio is calculated by creating a ratio of the volume on days when price increased to volume on days when price decreased.

Pages