Other

Stock Split Finder

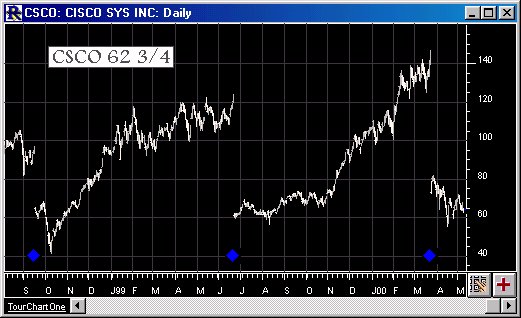
The Split Finder may be added to a chart window or used in a scan to locate stocks with abrupt price changes indicative of stock splits. You may specify a percentage price change from one day to the next that the Split Finder will use to locate possible splits. The default is 10% When the Split Finder is added to a chart window, the title bar of the chart pane indicates if a split has been detected. When the mouse points to the effective date of the split the title bar will indicate the date and the split ratio found.

Parabolic SAR (SAR)

The Parabolic SAR, developed by Welles Wilder, is used to set trailing price stops. SAR refers to "Stop-And-Reversal". It is designed to create exit points for both long and short positions in such a way that it allows for reactions or fluctuations at the beginning of the position, but accelerates upward (for long positions) or downward (for short positions) as the movement tops out. Parabolic SAR is plotted around the price chart similar to a moving average. The Parabolic SAR provides excellent exit points. Wilder suggests using this indicator in a trending (or directional) market.

Reverse Engineer

The Reverse Engineer indicator answers the following question: "What current price would be required to attain an indicator value of X". For instance, you may want to know what closing/last price (on a daily chart) would be required in order for the RSI value to reach 70. Or you might want to know what high price would have to be reached (on a daily chart) in order for the current day's range to exceed its average range over the past 20 days.

Relative Strength (RS)

Relative Strength indicates the movement of a symbol relative to a base instrument. It tends to be flat. If the base instrument has stronger movement than the monitored instrument, the Relative Strength line will dip down. If the monitored instrument has stronger movement than the base instrument, the line will rise. An example of a popular base instrument might be an index such as the Dow Jones Industrial or the S&P 500. To select a base instrument, click Setup>Preferences>Chart Studies and select "Relative Strength" from the Technical Indicator drop-down menu.

Percent Change Volume or Price

The Percent Change Indicator calculates and draws a line showing the n-period percent change in either volume or price for an instrument. The indicator oscillates around zero with positive values indicating increasing prices (or volume) and negative values indicating declining prices (or volume). If you wish to see both percent change to volume and percent change in price in the same chart, apply the indicator multiple times , once with "Price" check marked, and again with "Volume" check marked. You can add both to the same chart window pane if you like.

Oscillator/Summation

The McClellan Oscillator and Summation Indexes were developed by Sherman and Marian McClellan in 1969. They were developed to gain an advantage in selecting entry and exit times in the stock market.

The McClellan Oscillator offers many types of structures for interpretation, but there are two main ones. First, when the Oscillator is positive, it generally portrays money coming into the market; conversely, when it is negative, it reflects money leaving the market. Second, when the Oscillator reaches extreme readings, it can reflect an overbought or oversold condition.

On Balance Open Interest

The On Balance Open Interest for an n-day period is defined as the sum of all Open Interest for up days minus all Open Interest for down days. An up day is one where the price closed higher or the same as the previous day. The On Balance Open Interest study calculates the n-day Open Interest for each day and charts it as a line which can oscillate around the zero line.

Modified Moving Average

The Modified Moving Average is an algebraic technique that makes averages more responsive to price movements. The average includes a sloping factor to help it catch up with the rising or falling value of the security.

MACD

MACD is an acronym for Moving Average Convergence Divergence. Developed by Gerald Appel, MACD utilizes various exponential moving averages of closing price to generate buy and sell signals. Exponential moving averages assign greater weight to the most recent price data and therefore are more sensitive to current price movement than simple moving averages. MACD consists of a Differential Line and a Signal Line. The Differential Line is constructed by measuring the difference between two exponential moving averages, typically a 12- and 26-period.

Keltner Channels (KELTU, KELTD)

The Keltner Channel is a volatility-based indicator which makes us of the "envelope theory" and uses the range of high and low. Moving average bands and channels, like the Keltner Channels, all fall into the general category of envelopes. Envelopes consist of three lines: a middle line and two outer lines. Envelope theory states that the price will most likely fall within the boundaries of the envelope. If prices drift outside our envelope, this is considering and anomaly and a trading opportunity.

Pages