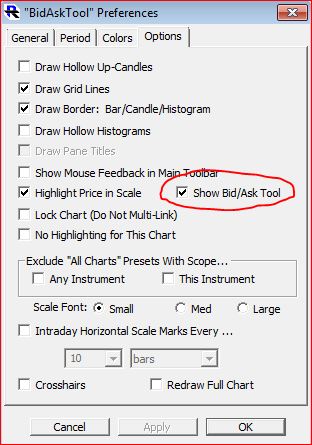
The Bid/Ask Tool is available to all multi-pane bar/candle charts. To turn on the Bid/Ask tool, bring up the chart preferences (by double-clicking in time scale at bottom of chart) and navigate to the Options tab. The checkbox is circled in red below.
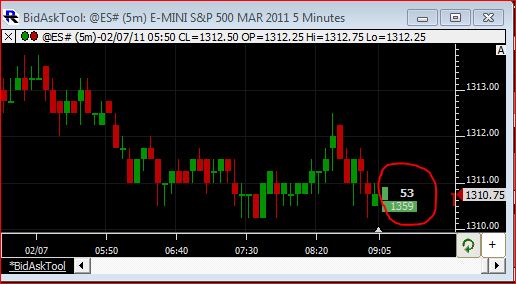
When the Bid/Ask tool is activated, a small histogram will appear to the right of the current bar, overlaid with text. The text and histogram represent the current ask size (top) and bid size (bottom). When the bid size is larger, the histogram is colored green signifying that we are more likely to tick up next. When the ask/offer size is larger, the histogram is colored red signifying that we are more likely to move down next. You might need to create room for the bid/ask tool. To do so, simply position your mouse just to the right of the current bar until it the cursor changes to two vertical lines. Then mouse down and drag left until you've created enough lookahead space for the bid/ask tool.