When users trade with an educator or a trading group, questions sometimes arise about charts that do not precisely match the charts of others in the group. Here are some possible causes:
- One party is using a broker data source (such as Interactive Broker) and the other is using data from a subscription data source like IQFeed or DTNMA. Read the support article Brokers Data vs. other Feeds to understand the added value of having a true tick by tick data source such as IQFeed or DTNMA.
- One party is using continuous contract data for futures and the other isn't. This will induce differences if the chart's lookback period involves data from several front-month contracts. Read more here.
- One party has a different Start Date/Start Time set in the chart than the other. Being off by even a single minute can cause indicator calculations to differ in subtle ways. Starting date/time must always match precisely.
- Different Session settings between users. When you exchange chart setups (definitions) with others, Investor/RT shares the session numbers in the shared chart definition. Differences will arise if the session times on User A's machine differ from session times on User B's machine. For example, User A might have a Day Session to start at 9.30AM and end at 4:00 PM (cash session end) whereas User B might have his day session ending setup at 5:00 PM (Globex session end). See the Sessions 101 support page for more on Sessions setups (and ensure that your session start and end times match those of other in your group).
- One party is using a time independent chart (e.g. Volume Bars) and the other uses a time-based chart (e.g. a 5-Minute chart. For example, a 5000 Volume bar chart with a start time of 9:30 AM, may not start right at 9:30 AM because each candlestick in the chart will not start and stop based on the time. Hypothetically, if a 5000 Volume bar starts at 9:29:59 and requires 30 seconds to complete that requires volume, the next bar will start at 9:30:29. In this case, the chart will differ from a time-based chart where bars are timed to start precisely at fixed intervals. See this related Help Desk Article to learn more about how periodicity effects indicators that rely on time.
- If the indicator that you are trying to match is the Profile Indicator, please take a screenshot of each Indicator Preferences window and compare every indicator setting. Moreover, it is important to understand that if you want to calculate precisely a VPOC over the last 30 days, this does require having tick data for that period (i.e., your tick data retention settings must be higher than 30 days). If no tick data is available for a given period, I/RT is using an algorithm to estimate that VPOC value (based on 1 min bar data). This does mean that if a user have a 30 day tick retention settings and another just 10 days, they might not see the same eaxct profile shape or VPOC value.
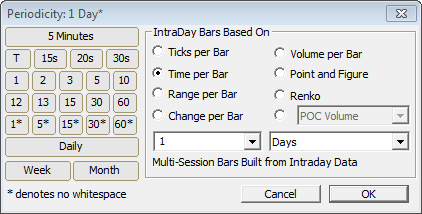
- One chart is a Daily periodicity and one is time based built with One minute bars. Charts with a "Daily Periodicity" are constructed using the Open, High, Low, Close and Volume for the entire session. The exchange sends these 5 values to Investor/RT to use to display a Daily bar. These bars have no knowledge of what transpired at any particular time or price during the session. If User A is using a Daily periodicity chart and User B is using a 5 Minute chart, the charts will not match. The solution is to change the periodicity of the Daily chart to 1 Day* (as shown below). Using 1 Day* vs Daily as shown below will provide greater accuracy. For 1 Day* periodicities, Investor/RT requests 1 Minute date and builds the bar using each minute from the session:
IMPORTANT
If the suggested reasons above do not explain the differences you are seeing, obtain a chart definition from the other party and import that chart (File > Open > Definition). If the charts do not match on your own system, then you should be able to compare the chart preferences and preferences for indicator setups to find the mismatch. If you require assistance from Linn Software, please be sure the submit both chart definition with your support request.