First, create a quotepage which contains the group of stocks or symbols on which you'd like to create your cumulative A-D Line. Now download enough daily data on the quotepage to cover the desired period. In our example, we'll create an A-D Line on the S&P 500 from January 1, 2004 to present (August 20, 2004).
Once you've downloaded enough data, we'll need to create two custom indicators which will provide us with what we need.
The first custom indicator will have the following syntax:
(CL > CL.1) + (CL.1 > CL)
This custom indicator will simply give us a +1 when the stock's price increased from it's previous day's close, and a -1 when the stock's price decreased from it's previous day's close. In other words, a +1 for advancers, a -1 for decliners, and a 0 for those that go unchanged (CL = CL.1). Save this custom indicator with a name like "AD_Direction".
Now create another custom indicator with the following syntax:
STAT(QSTAT)
STAT is the Statistics indicator and should be setup as seen below:
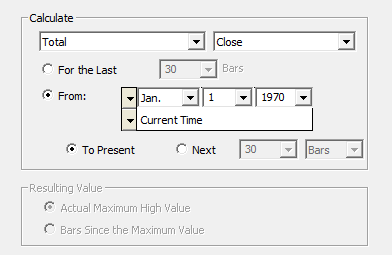
This gives us our "cumulative" effect. The date "Jan. 1, 1970" is just an arbitrary date far in the past (guaranteed to be before the begin date of the chart we'll create below). By setting up STAT in this fashion, it will just accumulate the QSTAT values over whatever period our chart is set to.
QSTAT is the Quotepage Statistics indicator and should be setup as seen below:
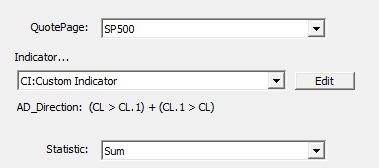
In our example the QuotePage is set to our "SP500" quotepage but you should set this to whatever quotepage you'd like to compute the A-D Line on. The "Indicator" should be set to "Custom Indicator". Click the "Edit" button and make sure the proper "AD_Direction" custom indicator is selected as our target custom indicator. Choose a "Statistic" of "Sum". By setting up QSTAT in this way, it will "Sum" up all our "AD_Direction" values for each stock in our quotepage "SP500" and return that total. STAT will in turn take these resulting values and accumulate them. If you preferred to not accumulate the values, just take out the "STAT" part and use a syntax of simply "QSTAT".
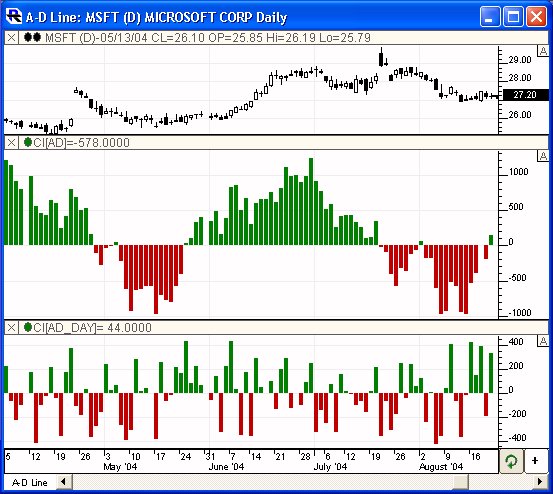
Now save this custom indicator with a name like "AD" and add it to a daily chart of any symbol in the target quotepage. The chart below shows the cumulative A-D Line ("STAT(QSTAT)") in the second/middle pane. The lower pane shows the daily/non-cumulative A-D value ("QSTAT"). This chart is setup with a Viewing Period of "Begin (1/1/4) to Present".