The Market Structure High (MSH) is commonly defined as a series of three candles in which the high of the middle candle is higher than the high of the candle to it's left and to it's right, as seen in the image below:
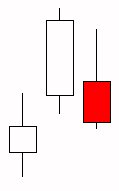
The syntax for the scan or signal which would detect this condition (on the third candle) follows:
HI.1 > HI.2 AND HI.1 > HI
...which basically states that the high of the last candle is higher than the high two candles ago, and the high of the last candle is higher than the high of the current candle. Sometimes an additional condition is added requiring that the close of the 3rd candle be lower than the open of the 3rd candle. The following syntax would be used in that case:
HI.1 > HI.2 AND HI.1 > HI AND CL < OP
The formation above would also meet this criteria, as the 3rd candle is a down candle.
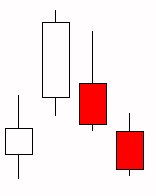
A common short "trigger" is used when a 4th candle breaks below the low of the 3rd candle, as can be seen in the figure on the right. This condition could be detected with the syntax:
HI.2 > HI.3 AND HI.2 > HI.1 AND CL.1 < OP.1 AND LO < LO.1
The MSH is commonly considered to have "failed" if price turns back to the high of the second candle.
Ideally, candles 1 and 2 are also "up" candles in MSH formations, adding these additional conditions gives us:
HI.2 > HI.3 AND HI.2 > HI.1 AND CL.1 < OP.1 AND LO < LO.1 AND CL.3 > OP.3 AND CL.2 > OP.2
This is indeed the case in the series of bars seen in the image above.