Creating Opening or Saving TPO Charts
- Create a New Chart: Go to File > New > Chart or Alt-0. Then choose the TPO Profile Chart as the Chart Style and choose a symbol and press OK.
- Save a Chart: Right click the chart and choose Save or Save As and give the chart a name.
- Open an Existing Chart: Go to File > Open > Chart or Alt-1. This opens the Object Manager set to Charts as the Object Type. You can than view all of your saved charts in the Object Manager. Select one or multiple to Open.
Import or Export Chart Definitions
Here are two ways to Import a Chart Definition:
- Go to File > Open Definition and Browse to the location of the saved Chart Definition and open it.
- Copy the contents of the Chart Definition text file to your Clipboard and then go to File > Open > Definition.
Here is how to Export a Chart Definition:
- Right click the Chart and choose Share Picture. A window will appear. Choose linnsoft.com and Include Definition and then press Share. The chart will open in your browser and a link to the chart will be placed on your Clipboard.
Mark the Open of each period with an "O"
The letter O is reserved for the first TPO/print of each bracket (letter period).
The letter O will be printed if...
- It is the first TPO/print of the first bracket of the profile.
- It is the first TPO/print of any bracket of the profile if...
- the brackets/letters are split into separate columns
- the brackets are not split but the "letter color" is such that brackets can be distinguished by color. Such letter colors include Market Day, Rainbow, and Custom.
The logic behind this behavior stems from the fact that the opening letter O is only useful if the user is able to visually distinguish which bracket that O belongs to. When all the letters are the same color, and the profile is not split into separate columns, users are unable to identify which bracket each O belongs to, thus actual letter that corresponds to that bracket is printed instead. When brackets are split, or when brackets are painted with different colors, it's clear which bracket each TPO belongs to by the color or position, so an O can be printed for the opening print without any loss of information.
If a user would like to see the O's but is not using a letter color which provides for them, just shift-click on any profile to quickly split the letters into separate columns. The O's when then become visible and apparent. Shift-click the profile again to unsplit when done.
Display Overnight and Day Sessions separately
IMPORTANT!
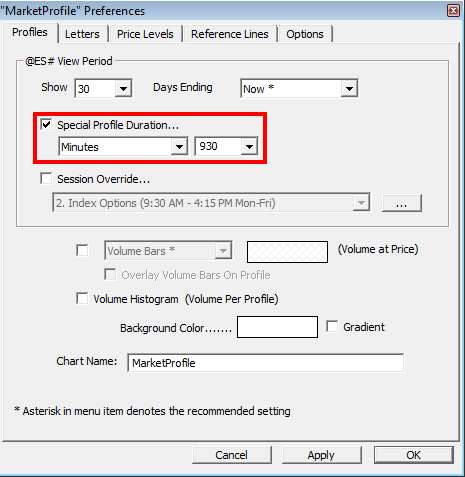
Please don't use the numbers in the image below without counting the number of minutes in your specific sessions. You should use the number of minutes between the open of your Globex session (usually 4:30PM EST or 6PM EST) and the open of the RTH session the next day (9:30 EST).
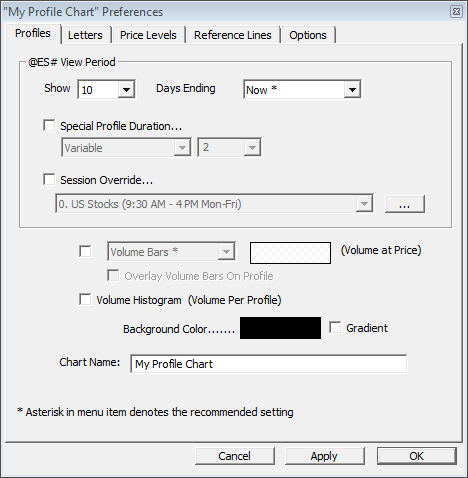
Simply setup the TPO Profile chart with the following preferences in the "Profiles" tab. Notice the "Special Profile Duration" is checked and setup with "Minutes: 930". In this example using session 31 (GLOBEX session), there are 930 minutes in the overnight period (from 18:00pm ET to 9:30am ET). This number of minutes may vary depending on the session you're using, but this is the most common setup. This will result in each day/session being split up into two profiles, one for the overnight period (18:00PM ET to 9:30AM ET) and another with the remainder of the session (9:30AM ET to 17:15PM ET).
Toggle between specific Sessions
Some users like to toggle between viewing the 24 Hour session (session 31) and another, shorter time frame session like the RTH session (session 0). Here's how to set it up:
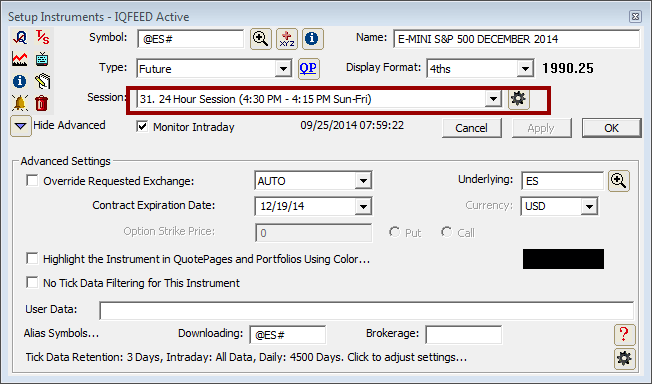
Set the Instrument Settings to Session 31:
First, open the instrument Set-up window by clicking Alt-A from within the chart. Set the instrument settings to Session 31 and click OK.
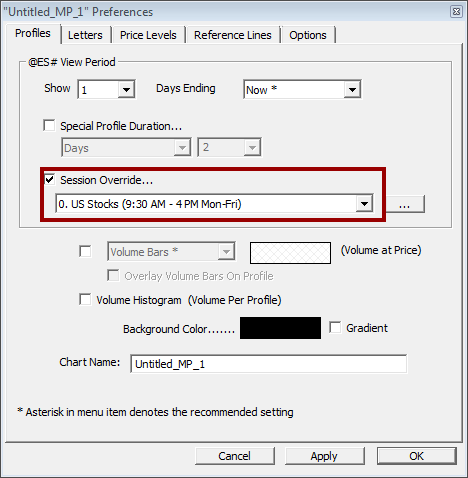
Set up a Session Override:
Right click in the TPO Profile chart and choose Preferences and go to the Profiles Tab. Check the Session Override box and choose the alternate session you'd like to toggle to. Then click OK to close the preferences window.
Test your Settings:
Right click in the chart and choose session over ride to toggle to Session 0. Right click again and deselect session over ride to toggle back to Session 31.
Toggle Splits to View each Letter Separately
To view each letter separately, use the "Toggle Splits" feature. First, decide whether you want to view each letter separately for the whole chart, or just one Profile. If you'd like to Split just one day, right click that Profile and choose Toggle Splits - This Profile. To Toggle Splits on all Profiles, choose Toggle Splits - All Profiles.
What are Singles in TPO Charts?
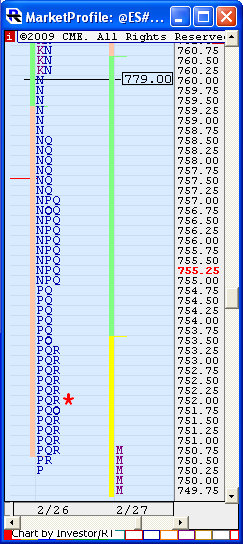
In TPO Profile charts, "singles" refer to prices within profiles which only contain a single TPO/letter but which are surrounded (above and below) by prices with at least two TPOs. If you look at the TPO profile chart to the right, notice that singles were created in the N period, as those singles have double TPOs both above and below them. However, if you look at the P at extreme low of the profile, that is not considered a single because there are no prices below it which contain 2 or more TPOs.
Given this definition of "singles", and based on user feedback, when singles are taken out (when the current price moves to touch a single from a previous profile that had not currently been touched since it's creation), then it is theorized that price will commonly continue to the extreme price of the profile in which the single was created. Therefore, singles are labelled with the extreme price of the profile in which the single was created. That extreme price will be the high price of the profile if the single was made on the way down, and the low of the profile if single was made on the way up.
NOTE: Singles within the current/rightmost profile will be labeled with their actual price, and not the extreme price. The label will change to the extreme price once the next profile begins, as the extreme price is only relevant in future profiles.
ADDITIONAL NOTE: As of version 10.0, an option has been added to the Price Levels tab of the TPO Profile preferences window titled "Label Singles with Extreme Price of Profile". If this option is not checked, all singles will be labeled with their actual price.
Notice in the chart to the right, that singles were created on the way down in the N period. While there are technically 5 single prices, the highest single made on the way down is the key single. If singles are created on the way up, the lowest key single is the one with the lowest price. And since this single is made on the way down, it is labeled with the high price of the profile (which happens to be 779.00). It is believed that if price returns to 760.00 during a subsequent profile ("takes out" the single), then price will continue to the high (779.00) of the profile in which it was created.
Why are my TPO charts labeled with dates that appear to be one day off?
The profiles in TPO Profile charts are labelled with the date on which they began (since the label is placed to the left of the profile). Therefore, on an overnight profile, each session begins on one day and then proceeds into the next day. So, for instance, the profile representing the session from 3/17/09 4:30pm to 3/18/09 4:15pm will be timestamped 3/17 and not 3/18, even though the day session for that profile is contained in 3/18.
Value Area computations: Method A vs. Method B
Method A
First, we count the number of TPOs in the profile, and take 70% of that number (70% is configurable by the user). This is the number of TPOs we're looking for in our Value Area.
Next, the Point of Control (POC) is determined by finding the price which contains the most TPOs. If there is a tie (two or more prices with same number of TPOs), the price closest to the center of the profile is used as the POC. The number of TPOs in the POC are counted and this number is used as our initial TPO count. At this point the Value Area only comprises the POC and the number of TPOs in the POC.
We now inspect the two prices above and below the POC. If the two prices below the POC have more TPOs, those prices are added to the VA. Otherwise, the two prices above the POC are added. We increment our TPO count by the number of TPOs in the prices we just added to the VA. We continue repeating this process, adding two prices at a time, until we have met or exceeded our 70% TPO Count, and completed our VA. The upper price of this Value Area is considered the Value Area High (VAH). The lower price of the VA is considered the Value Area Low (VAL).
Method B
First, we count the number of TPOs in the profile, and take 70% of that number (70% is configurable by the user). This is the number of TPOs we're looking for in our Value Area.
Next, the Point of Control (POC) is determined by finding the price which contains the most TPOs. If there is a tie (two or more prices with same number of TPOs), the price closest to the center of the profile is used as the POC. The number of TPOs in the POC are counted and this number is used as our initial TPO count. At this point the Value Area only comprises the POC and the number of TPOs in the POC.
We now inspect the two prices above and below the POC. If the two prices above the POC have more TPOs, those prices are added to the VA. If the two prices below the POC have more TPOs, those prices are added to the VA. If there is a tie, we add both the two prices above and the two prices below. We increment our TPO count by the number of TPOs in the prices we just added to the VA.
We continue repeating this process until we come to the point where adding two prices would exceed our 70% TPO count, at which point we begin adding one price at a time using the same method. Once our 70% TPO count threshold is met or exceeded, our Value Area is complete. The upper price of this Value Area is considered the Value Area High (VAH). The lower price of the VA is considered the Value Area Low (VAL).
View Bid or Ask volume within each TPO/letter
Prior to version 10.1 Beta 14, users could point at any TPO in the TPO chart and view the volume, buy volume, sell volume, and delta of that single letter within the Info Box.
This feature was removed (by default) in versions 10.1 Beta 14 and later, as storing these volume levels within each TPO increase the memory consumption of TPO charts 3-fold. There are two ways to recover this feature.
-
Set the "Letter Color" (in the "Letter" tab of the TPO Preferences) to either "Delta (TPO)" or "Volume (TPO)". Once you make that change, close and reopen the TPO chart and the information should be available again in the Info Box.
-
Go to *File > Preferences > Configuration and use the Find box to search for the Configuration Variable called MPLoadVolPerTPO and set this to True and press OK. Then Save your TPO chart and reopen it. Keep in mind this feature does pay a price in memory consumption.
Add TPO style to a Multi-Pane chart
Many of the visual aspects of Market Profile charts can be added to a Multi-Pane chart. Click here to learn more.
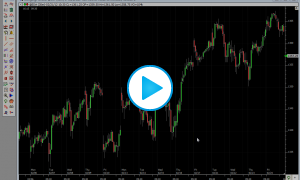
Investor/RT offers a very flexible TPO Profile charting capability. These chart types may be referred to as TPO charts (TPO = "time-price opportunity") or TPO Profile charts by other programs and services. Investor/RT's TPO Profile charts are highlighted by the following features:
Dynamic
All TPO Profile charts are dynamic, updating tick by tick (including VA, POC, IB, etc). The current price is highlighted in red in the scale.
Playback
The current session, or prior sessions/days can be played back using a variety of options, such as playing back one letter every 0.5 seconds. A video demonstration of playback is available at the top of this page.
Multiple Profiles
Up to 29 Profiles/Days can be shown simultaneously side-by-side in a given chart.
Intraday Profiles
Compose profiles of any number of minutes. Build separate profiles for overnight data versus RTH (regular trading hours). Profiles can be split at any letter.
Multi-Day Profiles
Any number of days/sessions can be combined (up to 40) into a single profile. Any profile can be merged with the profile to it's right by simply ctrl-clicking on the profile.
TPO Chart Info Box and Highlighter
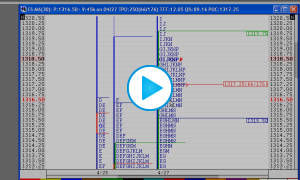
These two features are linked in that the Highlighter is turned on only when the Info Box is on. The Info Box can be seen along the left edge of the chart above. When the Info Box is on, mouse/cursor movements across the chart drive the new Highlighter, highlighting the cursor's row/price and the cursor's letter. The info box provides feedback on the location of the cursor, including profile-specific, row-specific, and letter-specific information.
Historical Profiles
Review profiles up to 58 days into the past.
Horizontal Scrolling
The chart can be scrolled back and forth horizontally using a horizontal scrollbar at the bottom of the chart, or by dragging/panning the chart right or left, or by using the left and right arrow keys on keyboard,
Vertical Scrolling
The chart can be scrolled up and down vertically using the vertical scrollbar along the right edge of the chart, by dragging/panning the chart up or down, by using the left and right arrow keys on keyboard, or by using the scroll wheel on your mouse.
Auto-Scrolling
The chart has both automatic and manual scrolling options. Automatic scrolling ensures that the current price will always remain visible in the chart window.
Each letter may be setup to represent any number of minutes from 1 to 1440, with 30 being the universal default.
Price Per Row
Each row of letters may represent all realized prices, or a user-specified price range.
Fonts and Colors
Ability to customize the font, the height range of the letters, and the letter color
Letter Shading
A "Shading" option which shades the letters darker as the day progresses (M much darker than A, etc).
Session Override
A "Session Override" setting that allows the user to view on RTH data for symbols that trade 24 hours.
Split Letters
An option to split each letter into a separate column is available. When letters are split, the historical developing VAH, VAL, and POC are charted, so the user may review where these values were during each letter period. Also, the opening letter of each period is printed in bold to clearly show where each period opened.
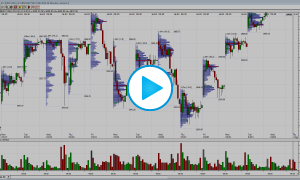
Volume Histogram
A "Volume Histogram" option which draws a subtle histogram behind each row/price, representing the volume traded for that row/price (or price range).
Start with YZ
A "YZABC" option which makes Y & Z the first two letters/periods of the day as opposed to A & B. This is a setting that is popular among T-bond traders.
Divide Columns x 3
A "x 3" option that divides each time period into three columns of ten minutes each showing the price levels reached in each ten minute period comprising one 30 minute period.
Draw Blocks
An option to "Draw Blocks" instead of letters, along with control of the width of the blocks. This option works well when combined with the "Shading" option. Blocks allow much more information to fit on the screen vertically, as they can be drawn much smaller/shorter than letter.
IB, POC, and VA
Options to draw reference lines for the Initial Balance (IB), the Point of Control (POC) and the Value Area (VA). These lines each have their own color and width, are labeled with price (optional), and drawn for both the current and previous day/session.
Reference Lines
Up to 6 optional user-customizable reference lines. Each reference line has a customizable label (optional) and price value. The price may be pulled from a V# variable, allowing it to be set in scans or other various places in the software.
Gridlines
Subtle gridlines may be optionally drawn between each row/price to make it easier to line up the price with the row when showing multiple days.
Mouse Feedback
Mouse feedback in the title bar showing the price, volume, and date, along with the day's TPO count, the number of TPO's above and below the POC, and the TFF, Q%, and POC values.
Open & Close Price Indicators
The open and closing prices of each session are marked by a vertical red line to left of each profile (for open) and a red asterisks * to the right of each profile (for close).
Timeline
An option rainbow colored timeline can be shown along the base of the chart, reflecting how far along time has progressed within the session, and seperating passed time into colored segments representing each letter.
Special Duration: Dynamic
When this option is selected, the duration of each profiles is then dynamic based on price action. The user supplies two periods. The first period represents the minimum number of letters that each profile must contain in order to be complete. If the second period is considered X, price must break out of the last X bar in order to form a new profile. For instance, if the periods are 20 and 12, then once the 21st letter begins forming, price is monitored for breakouts of the range formed by the previous 12 letters. If price breaks out of that range during the 21st letter, then the 21st letter breaks away from the profile and begins it's own profile, which again will build for at least 20 letters before looking for breakouts.
The TPO Profile Info Box can be brought into view at any time by pressing the Tab key when viewing a TPO Chart. Press Tab again to hide the Info Box. The data in the Info Box updates as the mouse is moved within the TPO Chart to point at a particular profile or letter. The table below describes the data that is displayed in the top part of the box which is broken into 4 sections as labeled in the image provided.
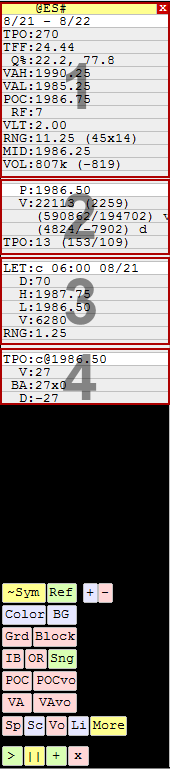
| 1 First Section Provides information related to each profile | |
| Symbol | The top line shows the symbol charted in the profile. To the right of the symbol is a red box with an X in it. Click that X to close the InfoBox. When the InfoBox is closed, a red box with an "I" will appear, which toggles the InfoBox back on. The InfoBox can also be toggled on/off with the tab key on the keyboard. |
| Date/Time | The second line/row shows the date/time of the profile over which the cursor is placed. |
| TPO | TPO = Time Price Opportunities. This is the total number of letters in the profile. If there are 8 D's, that counts as 8 towards the TPO count. This TPO count excludes single prints at the extremes of the profile. To the right of the TPO count, in parenthesis, you have (TPOs above POC, TPOs below POC), followed by the number of TPOs including the single prints at the extremes. The TPOs above and below will only be shown if the TPO checkbox is checked in the Price Levels tab of the TPO preferences. |
| TFF | Trade Facilitation Factor Number of total TPO's divided by the range of price for the profile. The higher the value, the less trend was present. Normal days have a high TFF value. |
| Q% | Quadrant of Open and Close (%) This represents the relationship of the first/open and last/close price to the overall range. The value can vary anywhere from 0% (first or last trade at very bottom of range) to 100% (first or last trade at very top of range). |
| VAH | Value Area High |
| VAL | Value Area Low |
| POC | Point of Control This represents the price/row in which the most letters reside. It is the widest row. This price was achieved in more 30-minute segments of the day than any other price. |
| RF | Rotation Factor Each letter is given a +1 if it's high is above high of previous letter, and a -1 if it's high is below high of previous letter. In addition, a +1 or -1 is added based on whether the low was above or below the previous low. Each letters RF (anywhere from -2 to +2) is summed to provide the RF of the profile. |
| VLT | Volatility Average range of the letters within a given profile |
| RNG | Range Range of price of each profile. To the right of the range, in parenthesis, is (vertical height of profile in prices/TPOs x width of profile in TPOs) |
| MID | MID price of the session, ie (High of the Day + Low of the Day)/2. Corresponding price is displayed with a letter "o" whenever the profile Value Area is highlighted through a vertical line |
| VOL | Volume Total volume of each profile. To the right of the volume, in parenthesis, is the delta of the profile (total volume that traded at the ask price minus total volume that traded at the bid price). The delta will only be available and accurate if you have tick data for the profile in question. |
| 2 Second Section Provides information related to each price in each profile | |
| P | Price |
| V | Volume traded at that price within that given profile. To the right of the volume, in parenthesis, is the delta of all the trades at that price within the given profile. In addition, on the next line, in parenthesis, is (total volume in the profile above this price, total volume in the profile below this price). |
| TPO | Number of TPOs/letters at that price in that profile. To the right of the TPO count, in parenthesis, is (number of TPOs above this price, number of TPOs below this price). This TPO count excludes single prints at the extremes of the profile. |
| 3 Third Section Provides information related to each letter in each profile | |
| LET | Letter represents all matching letters in the profile. For example, if you see "LET: K 13:00 06/30", that means this section applies to all trading in the K bracket and covers all the Ks in the profile. To the right of the letter is the time/date the bracket begins. |
| D | Delta of the period covered by the letter (delta of the bracket) |
| H | High of period covered by the letter (high of the bracket) |
| L | Low of period covered by the letter (low of the bracket) |
| V | Volume trading during the period covered by the letter (volume of the bracket) |
| RNG | Range of price of the letter |
| 4 Fourth Section Provides information related to each TPO (individual letter) in each profile | |
| TPO | Shows the letter and price (represents a single letter or TPO, a single price & time opportunity) |
| V | Volume of that single TPO |
| BA | Bid x Ask Volume of that TPO (volume traded at bid x volume traded at ask) |
| D | Delta of that TPO (difference between the ask traded minus bid traded volume. |
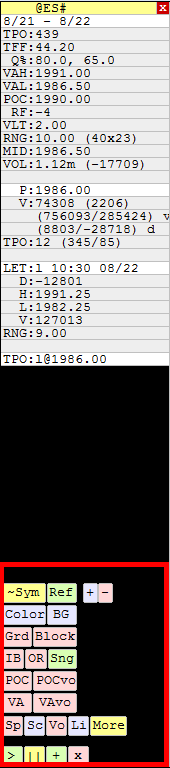
| This section describes what happens when clicking on the various buttons that are seen at the bottom of the InfoBox section of TPO Profile charts. This Info Box can be toggled on/off with the tab key. | |
| ~Sym | - Change Symbol of the chart |
| Ref | - Toggle the "Reference Lines" on or off. |
| Color | - Cycles through the various letter color options available. |
| BG | - Cycles through various background colors |
| Grd | - Toggles the gridlines on and off |
| Block | - Toggles "Draw Blocks" on and off. "Draw Blocks" draws squares in place of letters. |
| IB | - Toggles the IB (Initial Balance) lines on and off |
| OR | - Toggles the OR (Opening Range) lines on and off |
| Sng | - Toggles the Single lines on and off |
| POC | - Toggles the POC (Point of Control) lines on and off |
| POCvo | - Toggles the POCvo (volume-based Point of Control) lines on and off |
| VA | - Toggles the VA (Value Area) lines on and off |
| VAvo | - Toggles the VAvo (volume-based Value Area) lines on and off |
| Sp | - Toggles the Split Letters on and off |
| Sc | - Scale - Cycles between scale on left, scale on right, and scale on right and left |
| Vo | - Toggles the Volume (or Trade) Bars on and off |
| Li | - Cycles between 5 states: Thick Vert Lines Left of Profie, Thick Vert Lines Right of Profile, Thick Vert Lines IB Left VA Right, Thin Vert Lines w/ Hor Lines (no Lables), and Thin Vert Lines w/ Hor Lines (with Labels) |
| More | - Brings up the preference window |
| Playback Controls | |
| > | - Playback Play |
| || | - Playback Pause |
| + | - Playback Advance One |
| x | - Playback Stop/End |
| Keystroke | Resulting Action | Notes |
| Up Arrow | Scroll Chart Up One Row | Only has effect when chart is too big vertically for visible window. |
| Down Arrow | Scroll Chart Down One Row | |
| Right Arrow | Scroll Chart Forward One Day/Profile | Decreases the "X" in "Show X Profiles/Days" by one |
| Left Arrow | Scroll Chart Back One Day/Profile | Increases the "X" in "Show X Profiles/Days" by one |
| Shift-Right Arrow | Scroll Chart Forward One Day/Profile | Decreases the "X" in "Ending X Days Back" by one |
| Shift-Left Arrow | Scroll Chart Back One Day/Profile | Increases the "X" in "Ending X Days Back" by one |
| Shift-Up Arrow | Zoom In Vertically | Increases the "Show Height Range" values by one |
| Shift-Down Arrow | Zoom Out Vertically | Decreases the "Show Height Range" values by one |
| Ctrl-Up Arrow | Zoom In Horizontally | Increases "Block Width" by one. (for "Show Blocks" only) |
| Ctrl-Down Arrow | Zoom Out Horizontally | Decreases "Block Width" by one. (for "Show Blocks" only) |
| Ticker Symbol - Enter | Changes to that Ticker Symbol | Type in a new ticker symbol (like "MSFT") then hit Enter |
| Esc | Close the Chart | The Escape key can be used to close most all windows types |
| Ctrl-Enter | Open Chart Preferences | The Ctrl-Enter combination will open prefs on most all windows |
| Double-click | Open Chart Preferences | Double-click anywhere inside the chart window |
| Shift-Click | Toggles Splits | Toggles Splitting of Letters for Profile clicked on |
| Ctrl-Click | Merges Profile Right | Merges the Profile clicked on with the one to it's right |
| Ctrl-Double-Click | Splits Profile at Letter | Splits Profile into two Profiles at the clicked letter |
| Ctrl-Shift-Click | Removes Splits/Merges | Removes any splitting or merging from the chart |
| Shift-Move | Crosshairs/Highlighter | Hold down the shift-key while moving cursor across chart. This only works when the InfoBox is active. |
| Shift-Click "Block" | Cycles Through Fonts | Hold down the shift-key while clicking on the "Block" button in the InfoBox to cycle through all the available fonts. |
-
Adding Additional Reference Lines
Need more reference lines in your MP charts? This video demonstrates how to add up to 512 more using a V# variable trick..
-
Alerting to DVA Movement
This video demonstrates how to create alerts when the developing value area high or low moves up or down.
-
Automating Pivot, Support and Resistance Levels
This video demonstrates how to automate pivot levels, support and resistance levels and the pivot point price on the TPO profile charts.
-
Exporting Price Levels
- The following video from 2006 contains relevant information, however the user interface for TPO Profile charts has been substantially revised since this video was made.
This video demonstrates how to transfer TPO Profile lines such as VAH, VAL, POC, etc, over to bar or candle charts, and have them automatically update on a tick by tick basis.
-
How to create an infobox
This video was a response to a few user requests. First off, the video covers in depth how to create and use infoboxes within panes in Investor/RT. Additional topics include well as how to create two basic custom indicators and leverage them to demonstrate divergence.
-
Merged and split profiles
This video demonstrates how to use the Profile Indicator to create merged and split profiles as an alternative to the TPO Profile chart for both volume and time based profiles.
-
Profile Indicator
This video takes a comprehensive look at the many features and applications of the Profile Indicator to implement time and volume-profiles of any duration.
Video timeline
- Introduction and Overview - What this video will be working towards, including images of the charts we will create during video
- Chart Setup - How to optimally setup a charts colors, bars, etc, for use with the Profile Indicator.
- Adding Profiles - Several different ways to add the Profile Indicator to a chart....
-
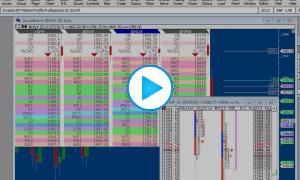
QuoteBoarding TPO Profile Levels
This video demonstrates how to plot TPO Profile Levels (VAH, IBH, etc) in the QuoteBoard. User variables are used to transfer these dynamic prices from the TPO charts to the QuoteBoard.
-
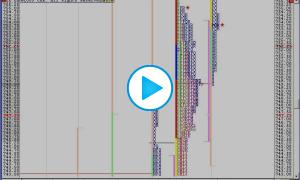
TPO Profile - Composite Profiles
This video demonstrates how to build automated composite profiles (weekly, monthly, quarterly, yearly, etc), as well as how to split or merge daily profiles.
-
TPO Profile Chart Preferences
This video highlights the TPO profile preferences.