Statistic

Time Series Forecast (TSF)

This technical indicator performs linear regression analysis. The value of TSF for each bar is based on a regression analysis of the preceding N bars. N is called the regression period in the setup window for TSF. The user specifies a forecast period F. F is used to derive a predicted price value, a forecast, F periods in the future based on the slope of the regression line for the preceding N periods. This indicator is often used in trading systems in conjunction with a moving average to generate trading signals when a moving average line crosses a time series forecast line.

Statistics Indicator (STAT)

The Statistics Indicator computes statistical measures (MIN, MAX, AVG, STD DEV) on a price types for a specified period, e.g. 100 period standard deviation of closing price.

Signal Statistics (SSTAT)

The Signal Statistics indicator (SSTAT) allows for statistical calculations on signals, including summation, consecutive signals, frequency, bars since last signal, change since last signal, and more. SSTAT allows the user to select any existing scan or signal, and any custom statistical result to calculate on that scan/signal. Currently, the available statistical results are:

Session Statistics (SESST)

The Session Statistics Indicator computes historical statistics for an instrument or an indicator. The The Session Statistics preferences use the general format: [Statistic] of [Price] of the [First/Last] X [Minutes/Bars] of the Session The Statistic options include:

QuotePage Statistics (QSTAT)

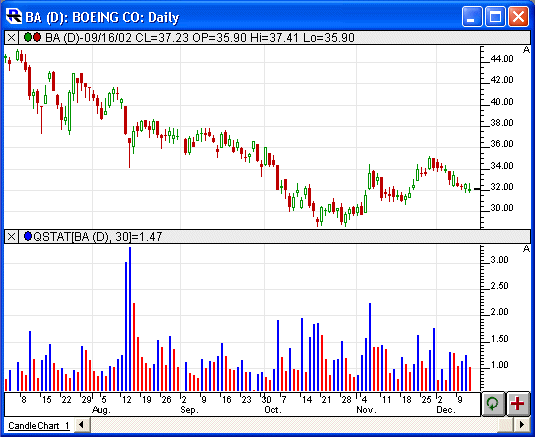
This indicator allows the user to calculate a variety of statistical results for any quotepage list of symbols, on any available technical indicator. The current list of available statistical results include Average, Sum, Maximum, Minimum, Percent of Average, Percent of Total, Percent Difference from Average, Relative Strength, Instruments with Data (Bars). For instance, you can calculate the average volume for a quotepage of symbols that contains the Nasdaq 100. You can calculate the average percent change on a quotepage that contains the S&P 500. You can calculate the maximum, minimum, average, or total spread on a quotepage that contains all optionable stocks. You can calculate the average (maximum, minimum) MACD (RSI, CCI, FASTD) for a quotepage that contains the DJI 30. You can calculate how many instruments in a quotepage evaluated TRUE for a given condition (using scan as the indicator). The possible combinations are expansive. As this indicator can be added to a chart, these values can be seen historically for all of the past bars. In order for this to work accurately, you must ensure that you have complete data on each of the symbols in the quotepage. You can verify this after adding the QuotePage Statistic indicator (QStat) to your chart by pointing to each bar. The feedback you see for each bar in the pane title for QStat will show how many symbols in the quotepage had bars on file for that time slot.

Pivot Point

The Pivot Point study is one which works best in markets with a wide daily trading range (high volatility). The study uses the previous day high, low, close, and open price to generate a pivot, two support levels, and two resistance levels. Because it is generated from daily data it is recommended that you check the "Use Daily" checkbox when adding this study to an intraday chart. Otherwise, the pivot point lines will be calculated using bars of whatever periodicity the chart is in.

Oscillator/Summation

The McClellan Oscillator and Summation Indexes were developed by Sherman and Marian McClellan in 1969. They were developed to gain an advantage in selecting entry and exit times in the stock market.

The McClellan Oscillator offers many types of structures for interpretation, but there are two main ones. First, when the Oscillator is positive, it generally portrays money coming into the market; conversely, when it is negative, it reflects money leaving the market. Second, when the Oscillator reaches extreme readings, it can reflect an overbought or oversold condition.

Open Interest Analysis

Add this indicator with a period of 1 to see the open interest for futures and options contracts. The open interest may be displayed as a line or a histogram. Specify a period greater than one to see a smoothed open interest line or histogram.

Linear Regression Slope

The Linear Regression Slope indicator provides the slope at each bar of theoretical regression lines which involve that bar and the previous N-1 bars (N being the regression period). First, the data, based on the price selected, is smoothed using the moving average period and type (specify a period of 1 if no pre-smoothing is desired). The resulting data is then used to form regression lines ending at each bar, using the regression period specified. The slope of each bars regression line is the recorded as the linear regression slope value for that bar.

Linear Regression Forecast

The Linear Regression Forecast indicators performs regression analysis on optionally smoothed price data, forecasts the regression lines if desired, and creates standard deviation bands above and below the regression line. First, the data, based on the price selected, is smoothed using the moving average period and type. If you prefer no smoothing, choose a period of 1. The resulting data is used to form regression lines ending at each bar, using the regression period specified.

Pages