Beta
Beta measures how strongly a security moves with a benchmark, usually an index such as the S&P 500. It answers the question: when the index moves by 1%, by how much does the security move on average?
To calculate beta, the bar-to-bar changes of the security are placed on an XY scatter plot against the bar-to-bar changes of the index, over a user-specified number of bars. The index changes go on the X axis and the security changes on the Y axis. A best-fit line (linear regression) is then drawn through these points. The slope of that line is beta, and the point where the line crosses the Y axis (the Y intercept) is alpha.
The relation between the two returns is:
SecurityReturn = Alpha + Beta * IndexReturn
Beta can also be written as :
Beta = Correlation x (Volatility of the security / Volatility of the index)
where correlation is the correlation coefficient of the bar-to-bar changes of the two instruments (see the COR indicator), and volatility is the standard deviation of those changes. This shows that beta depends on two things: how much more (or less) the security moves than the index, and how closely the two move together. A security can be much more volatile than the index and still have a low beta if its movements are only weakly related to the index.
How to read beta:
- Beta = 1: on average, the security moves by the same percent as the index.
- Beta greater than 1: the security tends to move more than the index. A beta of 1.5 means that, on average, the security rose 15% when the index rose 10%, and fell 15% when the index fell 10%.
- Beta between 0 and 1: the security tends to move less than the index. A beta of 0.9 means that, on average, the security rose 9% when the index rose 10%, and fell 9% when the index fell 10%.
- Beta near 0: the movements of the security are not related to the index.
- Negative beta: the security tends to move in the opposite direction of the index.
These are averages over the chosen period. On any single bar, the actual movement can be quite different, especially when the correlation between the two instruments is low.
Alpha
Alpha is the part of the security's return that is not explained by the movement of the index. It is the Y intercept of the best-fit line described above. A positive alpha means the security did better than its beta alone would predict; a negative alpha means it did worse.
In classical financial theory (the Capital Asset Pricing Model), a security with no excess performance is expected to have an alpha equal to the risk-free rate x (1 - beta). For intraday bars, the risk-free rate per bar is so small that the expected alpha is practically zero, so any clearly positive or negative alpha shows real outperformance or underperformance compared with the index.
Settings
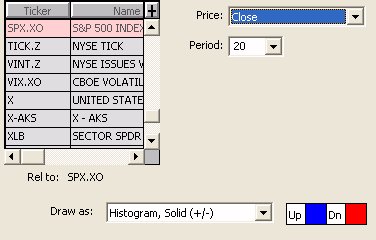
The settings windows for Alpha and Beta are similar and discussed in the Preferences tab. In the I/RT technical Library, "Alpha" and "Beta" are listed separately
Choosing the period and periodicity
- For long-term investment analysis, beta and alpha are commonly calculated over 3 or 5 years of monthly data, which means a monthly chart with a period of 36 or 60.
- For intraday trading, the same calculation can be done on time-based bars. For example, on a 3-minute chart of the E-mini Nasdaq-100 (NQ) with ES as the benchmark, a period of 60 to 100 bars (3 to 5 hours) gives a beta that reflects the current session. A shorter period reacts faster to changes but is noisier; a longer period is more stable but slower.
Use with the Relative Strength and Correlation Coefficient indicators
For NQ against ES, beta is usually above 1, because NQ is more concentrated in large technology stocks and tends to move more than ES in percent terms. This has two practical uses:
- Reading Relative Strength correctly. On a strong up move, the Relative Strength (RS) of NQ against ES tends to rise simply because NQ has a higher beta, not because of real outperformance. Alpha answers the question more directly: a positive alpha shows that NQ is doing better than its beta would predict.
- Balancing a two-instrument position. When trading NQ against ES, beta can be used to adjust the number of contracts on each side, so that the position is not simply a bet on the direction of the market.
Presentation
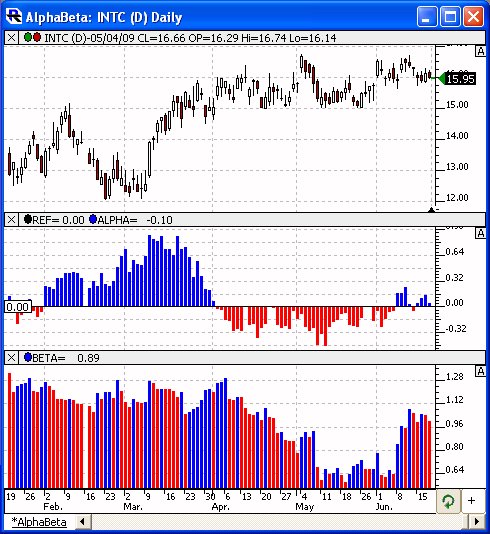
The chart above is a Daily chart of INTC. The middle pane shows the 20-Period Alpha of INTC relative to SPX (see prefs below). The lower pane shows the 20-period Beta of INTC relative to SPX.