For a global overview more about I/RT trading features, please review first this support page about order executions
ChartTradingDOM an RTX extension available to all Investor/RT subscribers. It may be used with the built in trading simulator or any brokerage destination (Rithmic, CQG, Interactive Brokers).To invoke the DOM, right-click in any multi-pane chart and choose Trade... (Make sure you have included your symbol in the generic TradingList Quotepage, otherwise the "Trade" menu line may not appear)
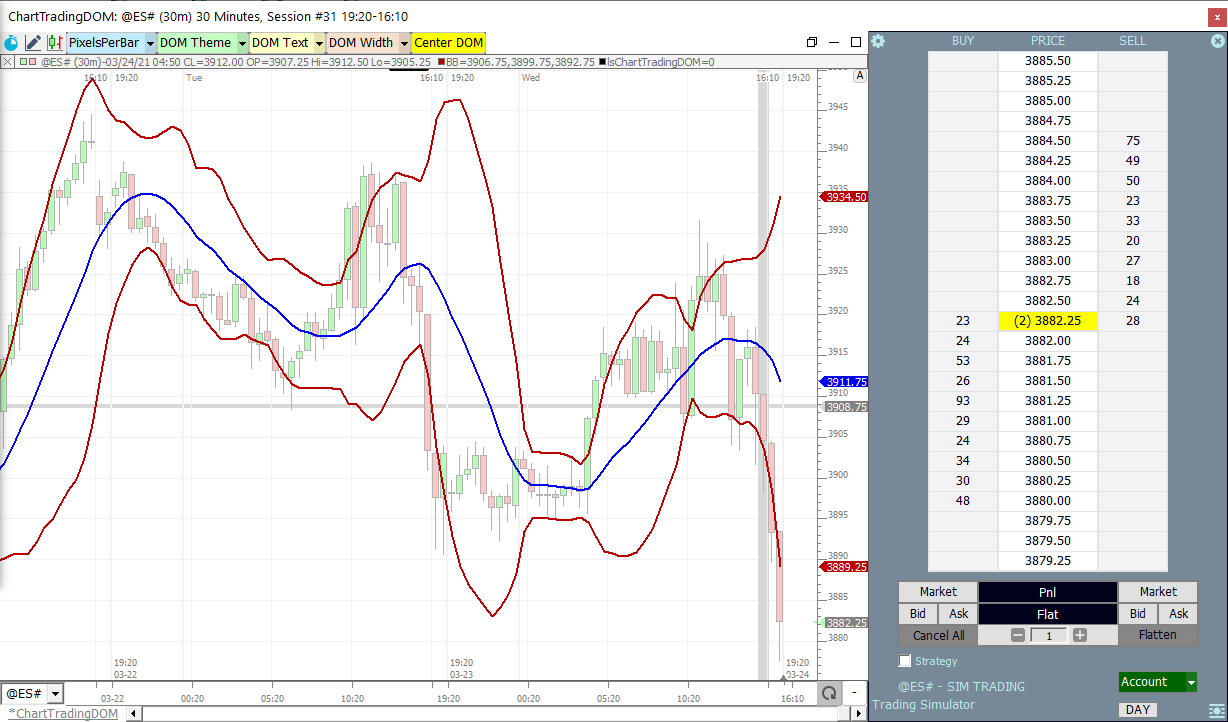
The ChartTradingDOM is a price ladder supporting single click in the Buy or Sell column to place limit/stop orders at specific prices.Buttons are provided for entering a position at the market or at the present bid or asked price. Current position status and P&L are shown beneath the DOM.
Click the P&L to cycle through various presentations of P&L (ticks, $, %, etc.). Working orders can be dragged up/down the price ladder and dropped to revise the working order stop or limit price.
Work order quantity can be revised by clicking the edit button. Automated order management (auto placement of profit target and stop loss orders) is under development.
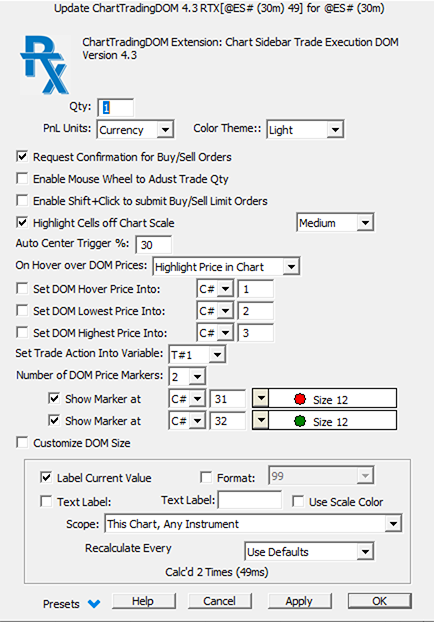
As you move the mouse over the price ladder or scroll the ladder using the mouse wheel, ChartTradingDOM highlights the DOM price level in the chart, making it easy to place orders and prices of interest depicted in the chart by various indicators. Further, the ChartTradingDOM enables the user to specify up to sixteen color-coded price markers that appear in the ladder based on V# or C# variables computed or set in various ways by the end user.
Here are the key additional features introduced with the release 6.0
- More compact Sidebar
- DOM Cell Height Adjustment
- Auto-Sync-Chart Scale
- ChartTradingDOM Button Events
- DOM Center Line
- Order-to-Buy (OB) and Order-To-Sell (OS) DOM Columns
- OB/OS Right click to Cancel Orders
- OB/OS Drag-and-Drop Stops and Limits
- Single click Stop/Limit Adjustment
- Mouse Wheel in OB/OS To Revise Multiple Limits or Stops
- Right click Quick Flatten
- DOM Price Blocks
- ChartTradingDOM and TradeViewer
- DOM Cell Height Adjustment The height of cells in the trading DOM, formerly limited to Small/Medium/Large, has additional, taller choices for traders who prefer larger DOM cells. The Cell Height can be adjusted in the ChartTradingDOM preferences. The cell height can also be conveniently changed at any time using the mouse-wheel. Position the mouse pointer outside the price ladder at the top right of the sidebar, e.g. over the SELL column heading; mouse-wheel up/down to set the cell height preferred.
- Auto Sync Chart Scale There is an option to keep the DOM price ladder and the instrument charting scale synchronized so the DOM prices line up nicely with the same price level in the main chart pane. When placing stops or limit orders, this facilitates placing the order at a price level indicated in the chart, just slide the mouse horizontally to that stop or limit price in the DOM. When auto-sync is engaged, using the mouse wheel inside the DOM price column scrolls the DOM prices displayed and scrolls the chart scale to keep the DOM prices aligned with chart prices. Whenever the user clicks to Center the DOM or when the DOM auto centers periodically, the chart scale is adjusted to the new center price, the current market price.
- DOM Center Line When the DOM is centered, ChartTradingDOM shows the center line slightly bolder than the cells above and below center. This enables the trade to see at-a-glance how far the market has moved since the last centering. Another scenario where the center line is useful is to easily align two different charts with DOMs of different instruments. This makes it easy to spot when price is moving in tandem or not, for example, ES and NQ aligned DOM’s where price action is moving above the center line for ES but differently for the NQ.
- Order to Buy (OB) and Order-to-Sell (OS) Columns When there are working orders active, the ChartTradingDOM shows a notation of the working order quantity and type (S for Stop, L for Limit). Buy Stops and Buy Limits are shown in the OB column at the left side of the DOM; Sell Stops and Sell Limits are shown in the OS column at the right side of the DOM. For example, if you see 3L in the OB column you know that you have one or more Buy Limit orders working at that price level with a total quantity of 3 contracts.
- OB/OS Right click to Cancel With orders working, a right click in the OB or OS column on a cell that denotes order(s) working at the price will send a Cancel Order to the broker for the order(s). Right-click on the OB (left side) of the DOM to quickly cancel buy limit or buy stop order; right click on the OS (right side) of the DOM to cancel sell limit/stop order(s) at the clicked price level.
- OB/OS Drag-and-Drop Stops and Limit With order(s) working, mouse down in the OB or OS column on a cell that denotes order(s) working at that price and drag the mouse up/down to drop the order(s) to a new price level. As you move the mouse above or below the original cell, the DOM shows a large, color-coded marker report how many ticks, plus or minus, the current position is from the original stop or limit price. When the mouse button is released on a different price level, Revise Limit or Revise Stop order(s) are sent to the broker and the DOM will then reflect the new working stop or limit. If you begin a drag/drop operation and change your mind about revising, simply drag the mouse off the DOM and release the mouse to end the operation with no effect.
- Single-click Stop/Limit Adjustment The DOM preferences include a checkbox titled Click Price To Revise Limit. Shift-Click to Revise Stop. When checked, the DOM will interpret a click in the Price column as a request to move the current limit order to that price. If there are multiple limit orders working, then the limit order closest to the current market price will be revised to the clicked price. Holding down the Shift key when clicking on a Price column cell moves the stop (or the nearest the market stop) to the clicked price.
- Mouse Wheel In OB/OS Column To Revise Multiple Limits/Stops When multiple limit orders are working, as seen in the chart below having two pairs of OCO brackets for a LONG 2 position, the mouse wheel can be used while hovering over either to OB or OS Columns to move ALL limits up/down for each click of the mouse wheel. Wheel moves in the OB column move all buy limit orders, while moves in the OS column move all the sell limit orders.
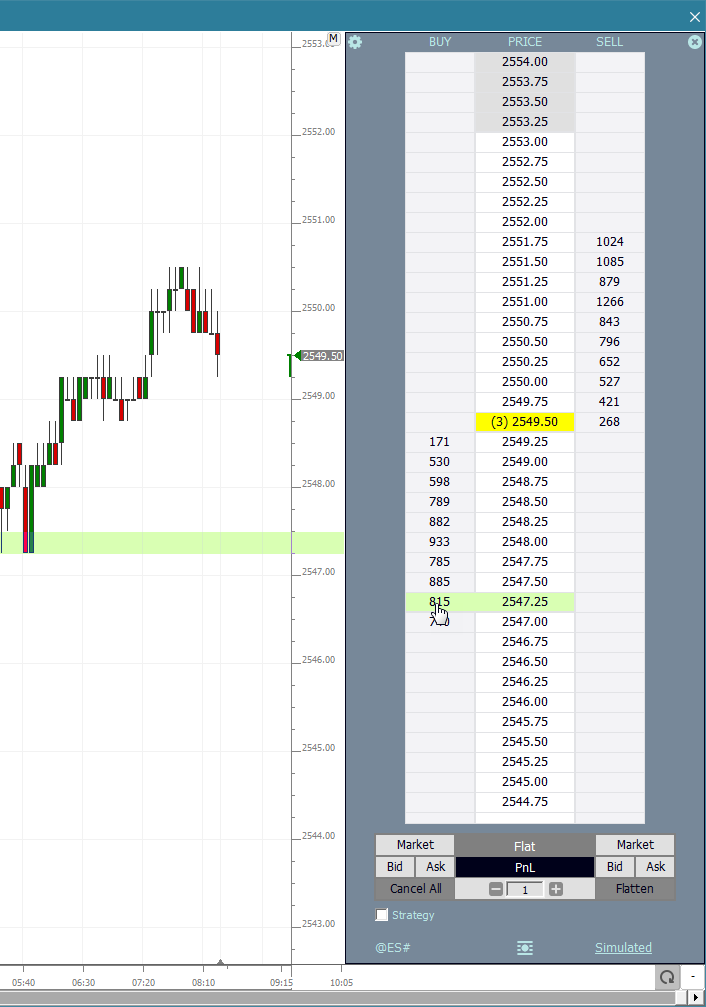
When multiple stops are working, you can use the same technique to move all stops up/down a tick at a time by holding down the Shift key while moving the mouse wheel. - Right click Quick Flatten When in a position, the average fill price of the position row is highlighted in the DOM (green for LONG; red for SHORT). A right click on the position price in the center price column submits a Flatten to the broker to exit the position, i.e. cancel all working orders and exit the position. Any other right click in the Price Column pops up a convenience menu for viewing today's trading results, the account name in use, the trading log, etc.
- DOM Price Blocks By default, the price column appears with all prices having the same background color. In the DOM preferences there is a checkbox titled Display Price Ladder in Blocks of... Checking this box and specifying a number results in the price ladder shown with blocks of alternating background colors. For example, for trading the ES you might use 4 prices per block, for MES 10 prices per block. Note that the number of prices per block can be specified as a C# or V# variable. This makes it easy to create a button in your chart to set a value into the V# or C# you select; This will enable you to dynamically change the number of prices per block in the DOM. The alternating background blocks are centered in the price ladder; thus when the DOM auto-centers or is manually centered by clicking the Center button, the current market price at the center will always be at the top of a block of prices.
- ChartTradingDOM and TradeViewer The trading DOM and trader viewer RTX extensions are designed to work together to enable the trader to visualize his open position graphically in the charting context while using the trading DOM to manage the position. Right-clicking inside the chart pops up a charting menu containing a Trade…submenu. Use the Trade menu to add ChartTradingDOM and/or TradeViewer to your charts. TradeViewer shows both open positions and closed positions. For active traders, we recommend that TradeViewer preferences be setup to hide closed positions while in a trade. For even the most complex positions involving multiple buys and sell to scale in an scale out of the position, TradeViewer can monitor and set the breakeven price of the overall position into a V# user variable. The ChartTradingDOM can then in turn be setup to Show a Marker at that specific V# price level in the price ladder. This enables the trader at all times to see his breakeven price and serve as a guide for setting stops using the new techniques of ChartTradingDOM 6.This integration requires that you have the TradeViewer running in the chart with the trading DOM to keep the breakeven price V# variable up to date as market price changes.
Here are the key additional features introduced with the release 6.5
Support for New RTX Button Events
- for sending buy/sell trading orders and various stop/limit price adjustment orders.
- for Buy or Sell at Market, Bid or Ask can be triggered by chart buttons or associated function key shortcuts.
The working stop or limit order nearest the market can similarly be adjusted up/down a tick using a chart button or keyboard shortcut. When multiple stops or limit orders are working, ChartTradingDOM events can trigger adjustment of all stops or all limit prices up/down a tick with a single click or function key.
I/RT version 15 now supports adding chart buttons to DOM sidebar, thus enabling custom trading interfaces to be setup with buttons near the DOM. ChartTrading DOM 6.5 also includes
- a custom cell height setting with larger price display font.
- a custom positioning settings in the DOM preferences allowing space for buttons or other RTX displays (e.g. Order Flow Metrics, FlexMeters) above, below, left or right of the DOM itself.
Presentation
Keyboard Adjustment
Mousewheel while hovering mouse pointer in the DOM area - Scrolls the DOM ladder up and down.
Mouse Wheel while over Quantity field - Adjust the Trade Quantity.
Right click the DOM outside of the ladder - Popup Menu with options DOM Preferences, Portfolio, Order Desk, Order Status and Trading Results windows.
Click center icon at the bottom of the DOM - Centers the price ladder on the current price (also available as an RTX Button Event)
Click the Portfolio name at the bottom right - Opens the active Portfolio.
RTX Events Supported by the Button Indicator to adjust ChartTradingDOM Appearance. With ChartTradingDOM present in a chart, right-click in the chart and choose Add Button. Set the button Purpose to RTX Event and choose one the following event names:
- "Width Full"
- "Width Slim"
- "Width Compact"
- "Text Small"
- "Text Medium"
- "Text Large"
- "Light Theme"
- "Medium Theme"
- "Dark Theme"
- "Center DOM"