The Paint Bars indicator is a powerful tool for Painting the Bars or the chart background different colors based on True or False conditions. The "condition" can be tested for True or False status using a Signal (or Scan formula), a Custom Indicator, an RTX extension, or simply by checking whether the current bar is inside or outside a particular Session. For each bar in the chart, a signal (or scan) formula is either TRUE or FALSE. You can choose specific colors for both the true condition and the false condition. If a custom indicator (or an RTX extension) is chosen as the painting criterion, then the custom indicator/RTX extension has an arithmetic value corresponding to each bar in the chart. In that case, three color choices are provided upon the input of 2 specific range values.
Example
Here is a simple example. Suppose you wanted your intra-day bar charts to highlight periods of time during which the instrument is trading above the moving average of closing prices for the preceding 10 periods. First, create a "scan" named "Above MA" with the RTL formula: CL > MA Where the MA moving average token is defined as a 10 period simple moving average. Open an intra-day bar chart of some instrument and add a "Paint Bars" indicator to the chart. Setup the paint bars indicator to use the scan named "Above MA" created above. Specify "Paint Background" using the menu at the bottom of the Paint Bars setup window. Place a checkmark in the box to the left of the "TRUE" condition color box, then click on the color and pick a highlighting color for the TRUE condition. You could also specify a different color for the FALSE condition, but in this example, leave the checkbox to the left of the FALSE condition color box unchecked. Then click OK to add the Paint Bars indicator to the bar chart. You will see all bars that closed above the moving average are highlighted with the TRUE color chosen above.
More flexible Paint Bars options are available today with the following RTX indicators:
1) The Paint Candles RTX offers differentiated coloring (inside/outside the candle body) based on 3 Separate Signals, including gradient color options
2) The Paint Indicator RTX when it comes to painting the chart background upon multiple Signal or Custom indicators conditions
Presentation
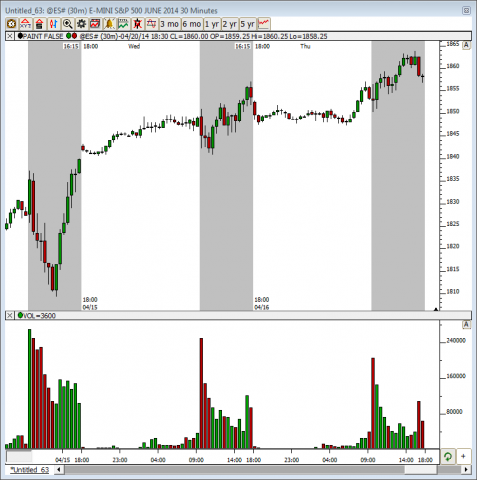
Above is a 5 Minute chart of the S&P E-mini.. The Paint Bars Indicator is used here to paint the background of the chart for periods that fall inside of the Day Trading Session.