The Position indicator is a versatile indicator: it calculates various output results related to the position of the bar with regards to multiple references such as session start or end (the calculated position can be expressed in bars, minutes, or seconds from the start or end of the trading session) or various calendar references (day/week/month/quarter/year).
It is primarily used through the POS token in the RTL syntax of filter rules within signal or custom indicators. Some outputs are also dedicated to being used inside SCAN or backtesting rules. Others, such as the main instrument pane pixel per bar or pixel per unit, will be stored in C# or V# variables and fed to other RTX indicators.
Here is the full list of results available using the Position Indicator, split into 5 categories:
POS token outputs involved in Bar Count calculations
- Bars from Start of Session: The actual number of existing bars from the end of the session. The last bar of each completed session will always be 1. In a current open session, the result of the most recent bar will reflect the theoretical number of bars remaining in the session.
- Bars from End of Session: The actual number of existing bars from the start of the session. The first bar of each session will have a value of 1, the second bar a value of 2, and so on. This result considers only existing bars and ignores any gaps.
- Bars from Start of Session (Theoretical): The theoretical number of bars remaining in the session. It ignores bars that may be missing or on which no trades occurred. The bar that ends at the session's end time has a value of 1. (Only valid for Time-based bar)
- Bars from End of Session (Theoretical): The theoretical number of bars from the start of the session. It ignores bars that may be missing or on which no trades occurred. The bar that begins at the start time of the session has a value of 1. (Only valid for Time-based bar)
- Bars from End of Data: The number of bars from the bar to the end of the data. This result is useful for performing backtesting cleanup on the last bar tested, for which the result will be 1 (POS = 1).
- Bars from Start of Data: The number of bars from the start of the data to the bar. This result is useful for performing backtesting initialization on the first bar tested, for which the result will be 1 (POS = 1).
- Bars in X Last Minutes: Number of bars that formed over the previous X minutes.
- Missing Bars in Session: The time-based bars that are missing thus far in the session. If the session begins at 9:30 on a 1-minute chart, a value of 10 on the 10:30 bar means there were 50 of 60 1-minute bars.(Only valid for Time-based bar)
- Missing Bars in Data: The time-based bars that are missing thus far in the data. This result can be useful in custom columns to detect incomplete data.
- Missing Bars over Period (Historical): The time-based bars that are missing over a given period specified below. This result can be useful in charts to detect incomplete data.
- Missing Bars over Period (Scan): The time-based bars that are missing over a recent period specified below. This result can be useful in custom columns or scans to detect incomplete data.
- Missing Bar in Chart: Count bars missing in chart.
POS token outputs involved in Duration calculations
- Percent into Session: Percentage of time elapsed in the session. (Only valid for Time-based bar)
- Seconds from End of Session: The number of seconds from the start of the most recent bar to the end of the session. The last bar of the session on a 15-second chart (the bar whose ending time coincides with the ending time of the session) would have a value of 15. (Only valid for Time-based bar)
- Seconds from End of Session: The number of minutes from the start of the most recent bar to the end of the session. The last bar of the session on a 10-minute chart (the bar whose ending time coincides with the ending time of the session) would have a value of 10. (Only valid for Time-based bar)
- Seconds from Start of Session: The number of seconds from the start of the session to the end of the bar. The first bar of the session on a 15-second chart (the bar which ends 15 seconds after the session start time) would have a value of 15.
- Seconds from Start of Year: Number of seconds from the start of the year.
- Minutes from Start of Session: The number of minutes from the start of the session to the end of the bar. The first bar of the session on a 10-minute chart (the bar which ends 10 minutes after the session start time) would have a value of 10.
- Minutes from Start of Year: Number of minutes from the start of the year.
- Minutes until Next holiday: Count minutes until next holiday.
- Days from Start of Data: Days from start of chart data, including weekends.
- Days of Week: The day of the week. Sunday = 0. Saturday = 6. Use the result "Trading Session of Week" to get the number of trading sessions in the week.
- Day of the Month: it returns the Calendar Day of the Month (1-31). Use result "Trading Session of Month" to get the number of trading sessions in the month.
- Weeks of Month: Count of weeks (resets at the start of every month)
- Weeks of Year: Count of weeks (resets at the start of every year)
- Month of Year: The month of the year. January = 1. December = 12.
- Quarter of Year: returns a 1 to 4 value
- Years back: Years back from the current year.
POS token outputs involved in identifying a Session within a chart
- Trading session of week: During first session of week, every bar has value 1.
- Trading session of the month. During fifth session of month, every bar has value 5. If a month begins during a session, the first partial session gets a value of 0.
- Trading session of the year. During fiftieth session of the year, every bar has value 50.
- Sessions from the end of the data. A value of 1 represents the most recent session. A value of 2 represents 1 session back.
- Sessions from the start of the data. A value of 1 will represent the first/oldest session of the chart/data. Values increase by 1 each session into future.
POS token outputs related to Price Action:
- Min Low to end of chart: Lowest low from each bar looking forward to the end of the chart. Lowest low from each bar to present.
- Max High to End of Chart: Highest high from each bar looking forward to the end of the chart. Highest high from each bar to present.
- Seconds to High: Number of Seconds from the Open of the bar to the High of the Bars.
- Seconds to Low: Number of Seconds from the Open of the bar to the High of the Bars.
- Milliseconds: Number of milliseconds on the timestamp of the last tick/trade of the bar. This results is live only and only available from IQFEED.
POS token outputs returning precise display information for any bar located in the main instrument pane
- Candle Width: Width in pixels of each candle body.
- Visible Bars: Number of bars in the visible chart area.
- Pixel Per Bar: Number of pixels per bar (horizontally)
- Visible Prices: Number of price levels in the range of the visible instrument pane = (Highest visible price in the vertical scale- Lowest visible price) / Tick Increment
- Pixels per Unit: Number of vertical pixels in chart divided by the vertical range of chart.
Note: with the last 4 parameters (that can be dynamically recovered through SET statements), you can return the exact xy position of any bar of a chart. This can be further used for a dynamic display of some RTX indicators such as the PaintIndicator, TrailOfInenttions, Footprint, PVP & more that includes custom position options involving right and left offset inputs (in pixels)
Presentation

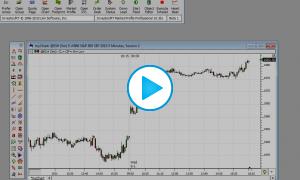
Above is a 5-Minute Candle Chart of the S&P Mini (ES). The Position Indicator has been added to the lower pane displaying the result "Bars Since Start of Session" and drawn as a histogram. The preferences seen below reflect those used for the Position Indicator above.