Charts including the Homework RTX indicators are not intended to be run with live data during the RTH session! It won't provide any detailed information for the current ongoing day session, but is designed to calculate statistics on large sample of past historical data only. Updating such a chart with tick by tick data during the RTH session will just slow down your computer (so don't forget to make a screenshot and close it before your live sessions)
Where does price go based on where price opens?
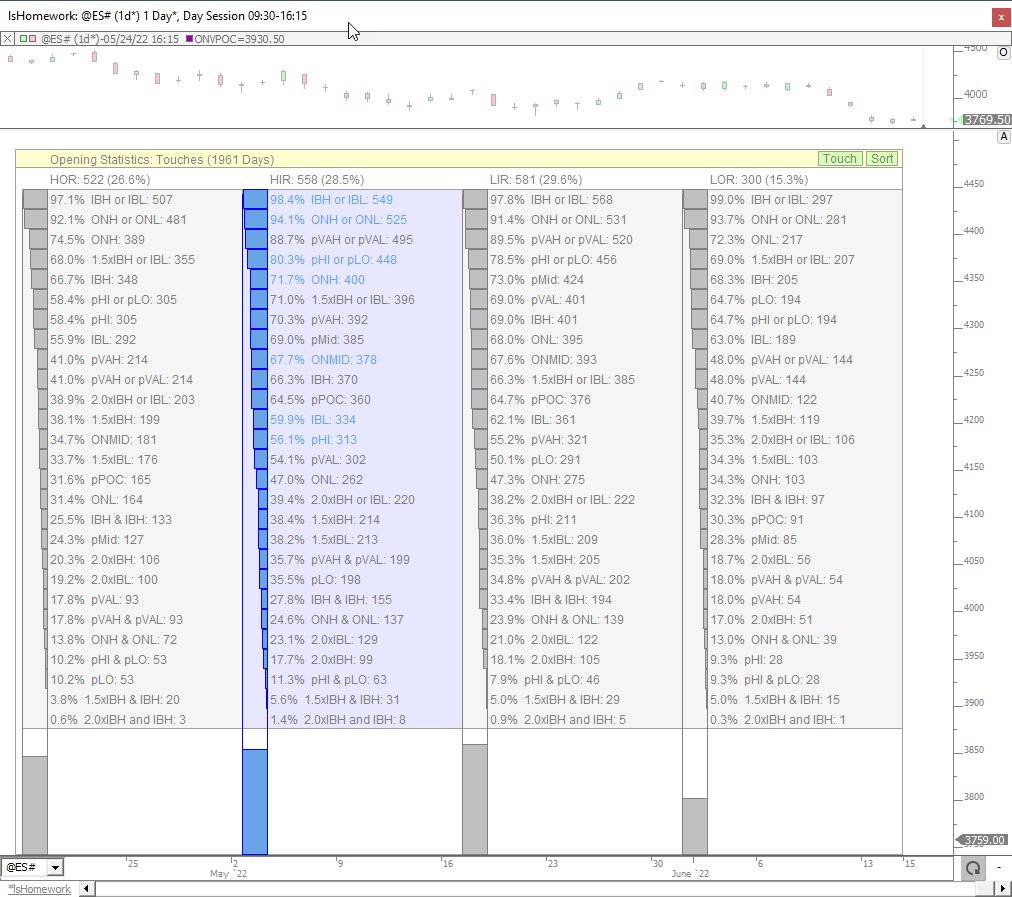
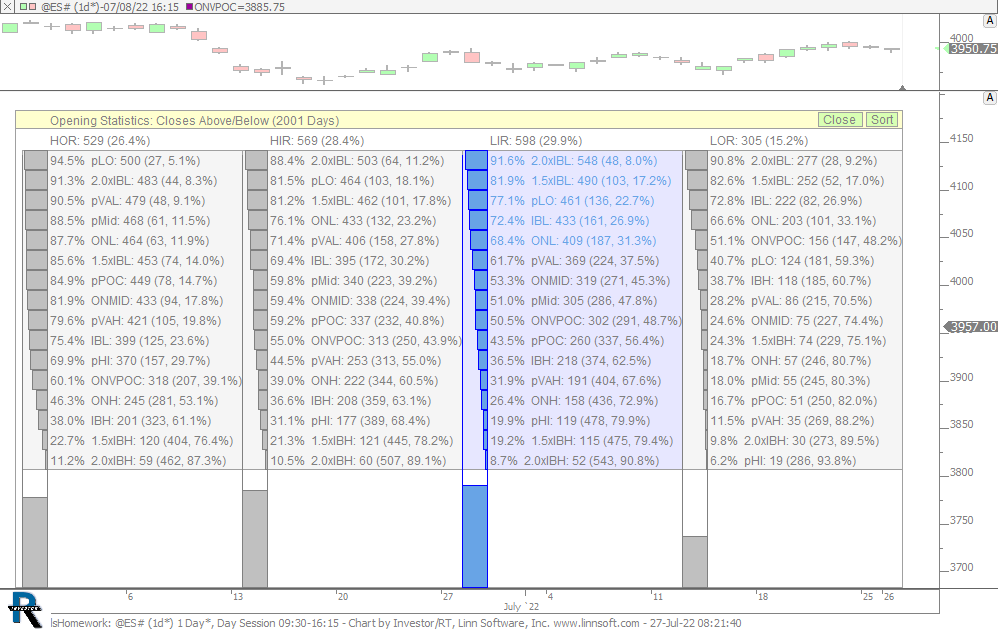
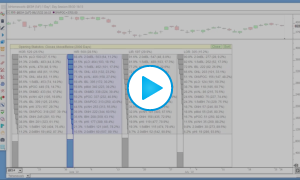
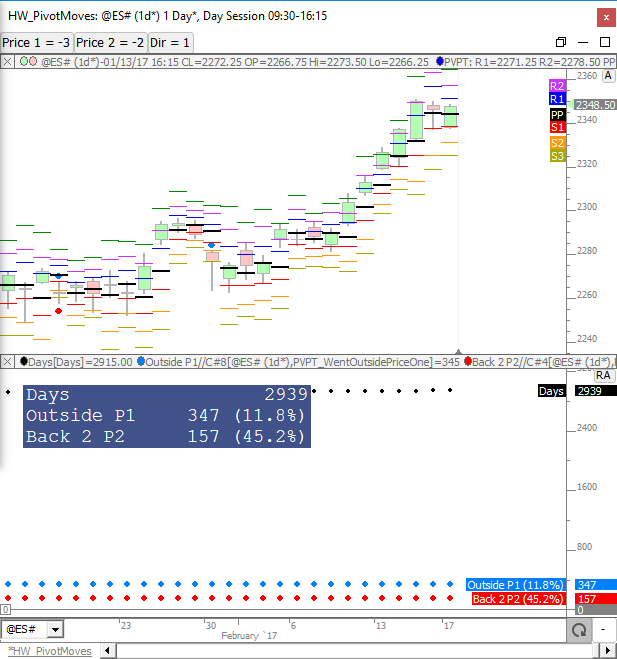
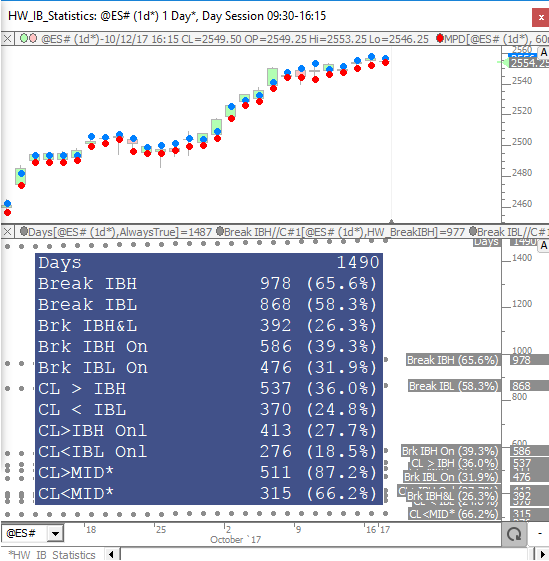
The Homework (HW) RTX Indicator is designed to compute and accumulate price-based statistics on daily data. The indicator is focused on percentages of touching or closing above key prices based on where price opens the day session. The statistics are placed in buckets based on opening positions of Higher Outside Range (HOR), Higher Inside Range (HIR), Lower Inside Range (LIR) or Lower Outside Range (LOR). If price opens the day above the previous day session high, it is considered Higher Outside Range. If price opens the day between the previous close (or Mid) and the previous high, it is considered Higher Inside Range. If price opens between the previous close (or Mid) and previous low, it's Lower Inside Range. And if price opens below previous day session low, it's Lower Inside Range. Within each 4 of these opening types (HOR/HIR/LIR/LOR) HW inspects how often we touch key prices as well as how often we close above or below these key prices. HW also looks at price pairs like 2xIBH/2xIBL, ONH/ONL, IBH/IBL and computes how often we touched both, one, or sometimes neither of the prices. The HW Indicator should always be added to a chart set to day session, and set to a periodicity of Time Per Bar: 1 Day (as this periodicity is built from tick / 1 minute data) and not the "Daily" one.
Important notes :
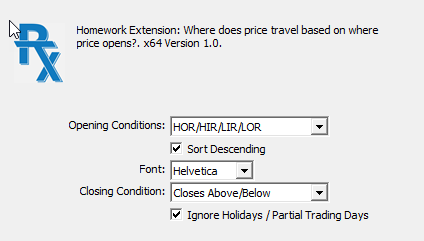
To run this very specific indicator, it is recommended to import the chart definition shared in the "Examples" tab
Homework RTX was created to gather in a single location all these market statistics, previously generated across multiple charts and studies, developed over the past 10 years by Chad L. Payne of Linn Software. If you want to learn more about these valuable studies, please visit the Homework series webpage (with more than 50 videos and chart definitions) or review the dedicated forum section.
Please also note that the Homework is not a black box. If you intend to understand how these stats are created using simple I/RT custom indicators, and possibly create variations or alternative statistics, have a look at this forum post. It provides 2 chart definitions with the Homework RTX indicator, but also a large sample of the underlying custom indicators that are, in fact, used "within" the core of the Homework RTX. Indeed, Homework RTX was primarily designed to consolidate the statistical values generated by +/- 100 individual custom indicators into a single report.
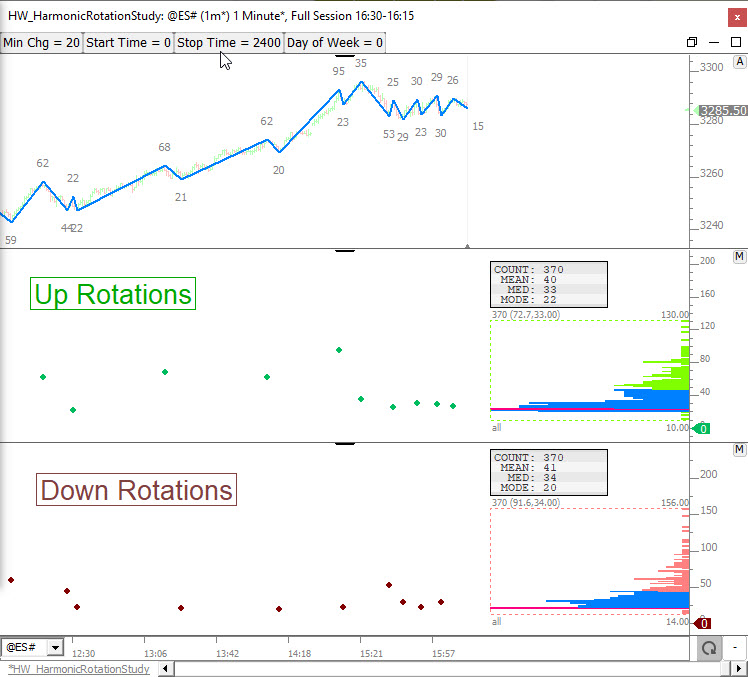
Check this video (from the Homework research series) to discover how the Signals Statistics indicator (used in conjunction with the MPD Indicator) is being set up to generate a specific statistic (the break of OVN high and low). This is in fact, explaining the way one may create any kind of statistic such as the one available in Homework RTX.
Presentation