How to add a line to an intraday chart that displays the current open, previous sessions closing price, previous session high and low, overnight high and low, initial balance high and low.
There are two indicators that will accomplish this: Session Statistics (SESST) and Mixed Periodicity Data (MPD). Session Statistics, a more reliable and efficient method, will be discussed first. One thing to keep in mind when deciding between the two methods is that MPD uses the daily bars while SESST uses the actual intraday data. Thus, MPD will always reflect the data present in the daily bars (which is generally the globex session data for futures) while SESST values will reflect the session to which the chart is assigned (can reflect either day session or globex session data for futures contracts).
Using Session Statistics (SESST)
Current Session Open
To access the current session open, setup the Session Statistic Indicator as seen below:
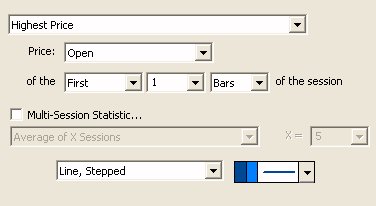
Which will result in the line seen below for 30 minute chart of ES set to session 2 (day session).
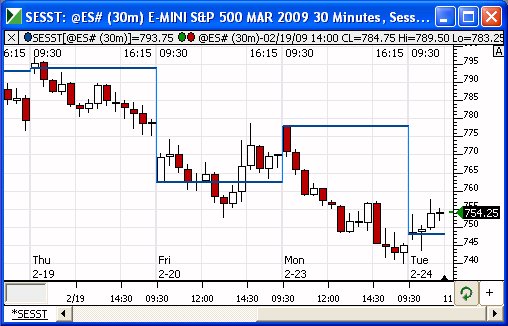
Notice the line reflects the open of the session to which the chart is assigned (in this case, session 2). If this chart was changed to a 24 hour globex session (session 31), the lines would then reflect the open of the globex session.
Previous Session Close
To access the previous session close, setup the Session Statistic Indicator as seen below:
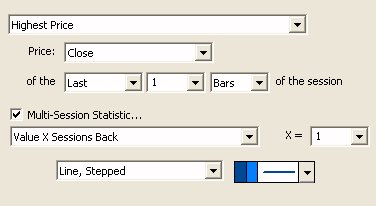
Note the "Multi-Session Statistic: Value 1 Session Back" setting.
Previous Session High
To access the previous session high, setup the Session Statistic Indicator as seen below:
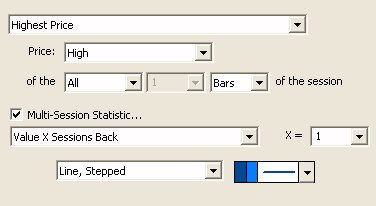
Note the "Price: High of All Bars" setting.
Previous Session Low
To access the previous session low, setup the Session Statistic Indicator as seen below:
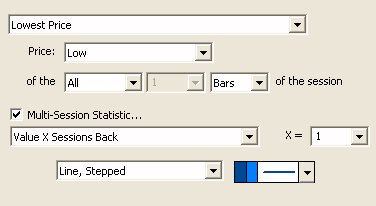
Note the "Price: Low of All Bars" setting.
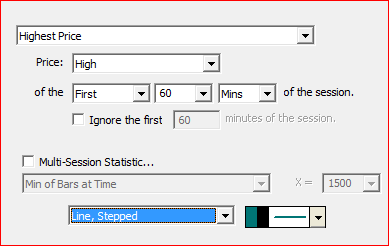
Initial Balance High
To plot the Initial Balance High (High of first 60 minutes of day session), setup the Session Statistic Indicator as seen below:
Initial Balance Low (on 24 hr chart using session 31)
To plot the Initial Balance Low (Low of first 60 minutes of day session) on a chart that is set to Session 31, setup the Session Statistic Indicator as seen below:
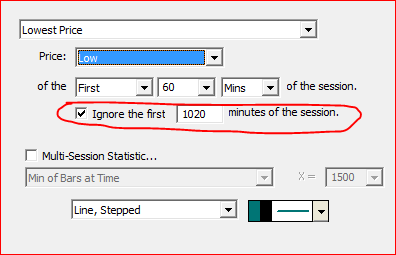
Notice that "Ignore the first 1020 minutes of session" is checked as their are 1020 minutes in the overnight period of session 31.
Overnight Low (on 24 hr chart using session 31)
To plot the Overnight Low on a chart that is set to Session 31, setup the Session Statistic Indicator as seen below:
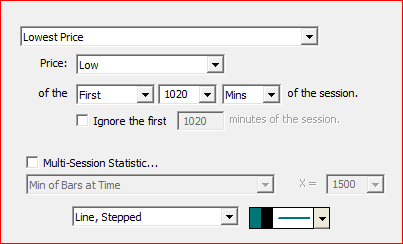
Notice that "first 1020 minutes of session" is specified as their are 1020 minutes in the overnight period of session 31.
Using Mixed Periodicity Data (MPD)
This can also be accomplished with the Mixed Periodicity Data (MPD) Indicator. Below is a 10 minute chart of MSFT. Two indicators have been added to this indicator to display two alternative solutions.
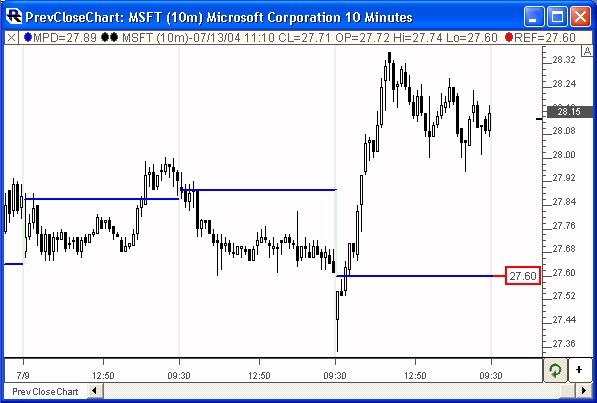
The blue lines are built by adding the Mixed Periodicity Data indicator directly to the charts using the settings below. As you can seen, these lines historically display the previous "daily" closing price.
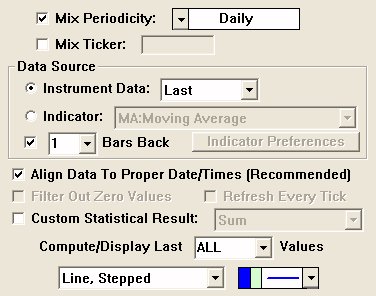
The key MPD settings here are "Daily" periodicity, "Last" data (price), and "1 Bars Back" to give us the previous daily closing price. To obtain the previous days high or low, the same settings would be used, simply replacing "Last" with "High" or "Low". This indicator will actually take the "daily" data and stretch it across the intraday bars. MPD is an extremely flexible indicator, and can be used to mix almost and combination of periodicity, ticker, and data, with any other combination of ticker and periodicity. One important note: You MUST have complete/accurate daily data on file for the symbols being studied in order for this to work properly.
MPD, however, does not label the line(s) with the price. The red line on the right side of the chart above was accomplished using the Horizontal Reference Line Indicator with the settings below.
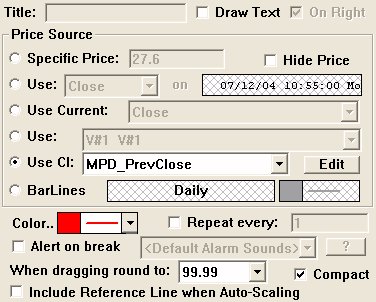
Notice that the "Price Source" of the reference line was "Use CI: MPD_PrevClose". CI stands for Custom Indicator. A custom indicator with the name of MPD_PrevClose was used to compute the price at which this reference line would be drawn. In this case, the custom indicator simply had the syntax:
MPD
Where MPD was setup exactly as seen above. Using custom indicators in this way inside reference lines provides the user with a way to get the "current" value of that custom indicator in a chart (no historical values). It also gives the user some flexibility as far as labeling the line (with the price, with customized test, on the left of right, etc.).
Also notice that the "Compact" option is checked. This option limits the drawing of the reference line to the small area between the last/current bar, and the vertical scale at the right. This area can be enlarged by increasing the "Look Ahead" period setting within the "View Period" tab of the Chart Preferences (Chart Preferences can be accessed by double-clicking on the horizontal scale along the bottom of the chart).
For more information on the Mixed Periodicity Data (MPD) Indicator, visit:
For more information on the Horizontal Reference Line Indicator, visit:
If your symbol is set to the 24 hour session, and you'd like to access the high, low, or close of the previous RTH (regular trading hours) session, visit: