The Bands Indicator draws a colored band between two fixed price points or two historical prices, typically computed by RTL customer indicators. Here is a quick overview of the different bands' styles split into different categories:
1) Styles based on 2 "Fixed" limits (ie "non-historical" bands)
Horizontal Bands: Horizontal Bands are drawn between two specific prices and from the left edge of the chart, to the right edge of the chart, with the top and bottom of the band being dictated by the selections for Price 1 and Price 2 (see possible input in the preference Tabs)
As an example, you may create two custom indicators that represent the previous session's high, and the previous session's low (using syntax "MPD"). These two custom indicators can then be used to draw a Price Band on an intraday chart that shades the area representing the previous session's trading range. If Prices 1 and 2 are based on 2 custom indicator values associated with the chart's periodicity, both horizontal lines (stretching across the entire chart) will keep adjusting to the latest calculated value of both indicators.
Compact Bands: these are similar to Horizontal bands, but it draws a solid band (aka a rectangle) in the right margin using the user-specified width (and both Price 1 and 2 inputs for the high and low price limit). Different compact Bands added to the same chart will be (horizontally) stacked in the right margin, except if you select the option Compact Band (Right Aligned)
2) Styles based on 2 historical sets of prices
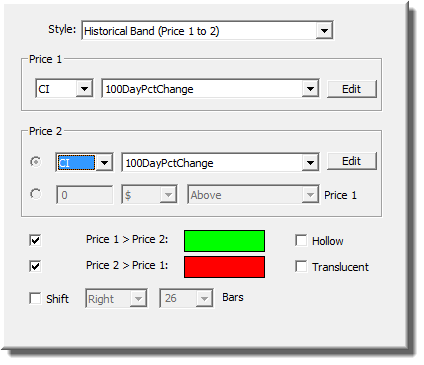
Historical Bands: While Horizontal Bands are drawn as solid bands between two current specific fixed prices, Historical Bands are drawn between two historical continuous lines. Two colors are specified to control what color the band is painted when Price 1 is above Price 2, and conversely when Price 2 is above Price 1.
Steps & Stepped Blocks (hollow and non-hollow versions): these are similar to Historical bands except that the lower and higher bands' delimitation lines are drawn using a Stepped line style, resulting in a block effect. This style also includes additional features
- The ability to draw colored retracement "blocks" as highlighted in this video focusing on Initial Balance Range extensions ranges
- Bands extension feature: when "Extend Naked" is checked, the bands on each bar will be extended into the future until taken out by a future price. As prices take out a part of the band, that part of the band is terminated while the remaining naked part of the band continues to extend. Options are available to extend bands for "Visible" bars in the chart, "All" bars or "All (Fresh Start)". This Fresh Start choice works just like the extend "All" option except it terminates the extensions at the end of each session and starts fresh. This option is useful for bands which only apply to the session in which they were formed and should not be carried forward to the subsequent sessions.
3) Styles designed to create customized candlesticks
Thick and Thin Bars: These bar styles draw vertical bars between the two prices (Price 1 and Price 2). The color of these bars can be customized based on whether Price 1 is above or below Price 2. The Thin Bar is drawn with a minimal width of 1 pixel, while the Thick Bar is drawn using the Pixels/Bar width of the underlying chart. These new styles can be used to create customized candlesticks (one Thick Bar for the body and one Thin Bar for the candle wicks).
Open Close Bars: This style is similar to the "Thin Line" and "Thick Line" options in that it takes two custom indicators, and draws a vertical line (thin) between the two custom indicators (Price 1 and Price 2). Actually, this style is exactly like the "Thin Line" option with one addition. It draws a small line protruding from the left of the vertical line at Price 1 (representing the "open" price), and it draws a small line protruding to the right at Price 2 (representing the "close" price).
4) Two Color Lines Styles
A Two Color Line is basically just any custom indicator, drawn in two colors, based on whether a specified Signal is TRUE of FALSE. The line also has a thickness that is specified in pixels (P). In other words, any line can be drawn in two-color mode, with any two colors and any thickness, based on any signal.
Final remarks:
- Please also be aware that the PaintIndicator RTX is, in many ways, expanding the visualisation features of the original Bands Indicator, with the PaintIndicator "Bands" style corresponding to "Historical Bands" and Bands(Custom) corresponding to 'Stepped Block". It offers, among others, the following capabilities:
- Custom coloring of Stepped bands, using Gradient rules or up to 6 different "Paint When" conditions (based on user-designated Signal or another Custom Indicator value)
- Additional Text and Label display features
- Detaching feature of the most recent CI bars into the right margin (as the Footprint RTX, TradeBubbles RTX or PriceVolumePattern RTX are capable of)
- The Price Band indicator can be selected by clicking on the very top or bottom of the band (by clicking on either Price 1 or Price 2). The Price Band acts just like all other technical indicators in that it can be drawn in front of or behind any other element (indicator or instrument) in the chart pane. Price Bands are also not limited to being drawn with instruments, but they can also be drawn along with standalone indicators. For instance, Price Bands could be drawn in the MACD pane, representing the area from the highest MACD value over the last 20 bars down to 10 points below it. Or one could use the Price Pane to simply draw between two constant prices. To obtain a constant numeric value from a custom indicator, simply use the syntax "VAR" and setup the VAR token with whatever numeric value you'd like, or use the syntax "10.5 + HI*0". In other words, a number by itself (syntax like "10.5") is not allowed in RTL. A token must be present somewhere in the syntax.
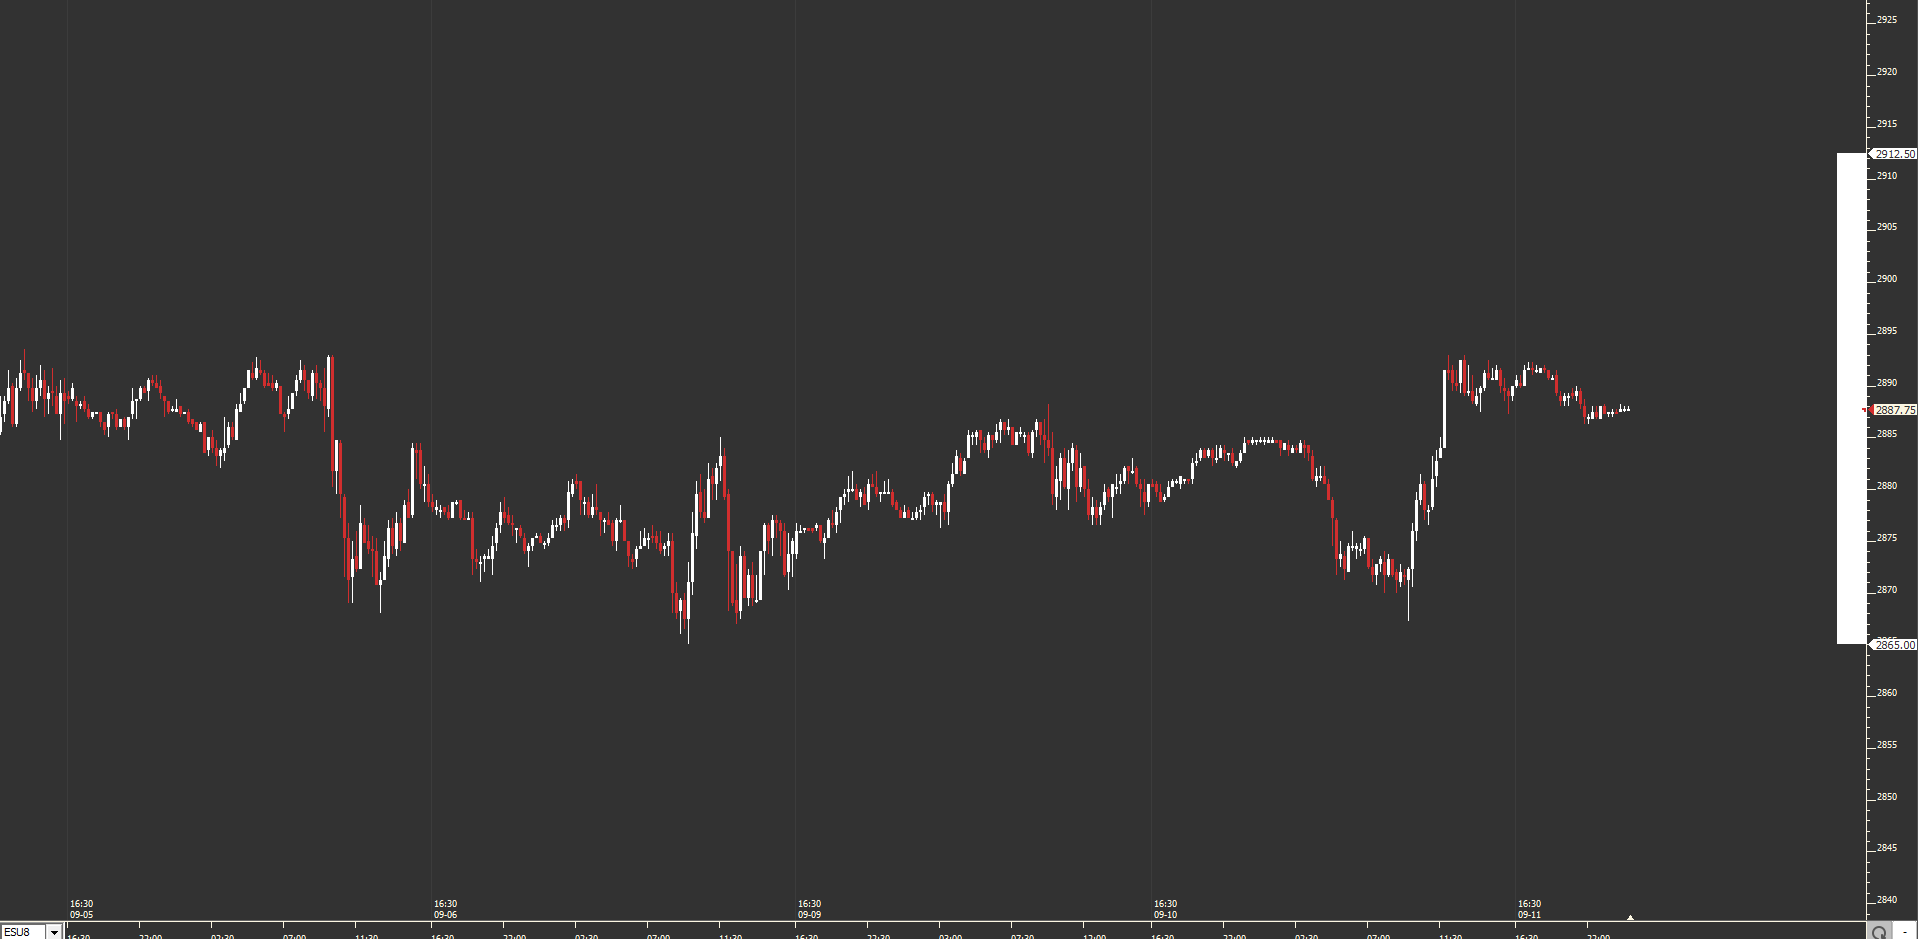
Presentation

Above is a Daily Candlestick Chart of Boeing Company (BA). Two Price Bands indicators can be seen overlaying candlestick chart. This green and red Price Band was drawn using the preferences seen below, and represent an historical band between a short (10-period) and long (20-period) term moving average. The blue Price Band was drawn as a "Horizontal Band" between the maximum high and minimum low over the past 5 bars.