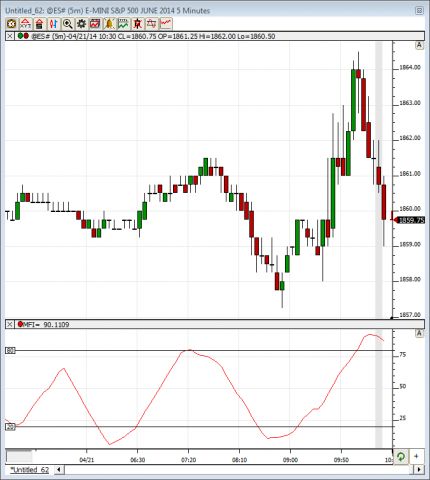
The Money Flow Index creates a ratio of Positive Money Flow and Negative Money Flow over time and scales it to a number between 0 and 100. The MFI value can be used to evaluate overbought and oversold conditions in a security the index moves above or below a certain reference level (Investor/RT defaults to 80 for overbought and 20 for oversold). Divergence between MFI and the price direction can also be indicative of a reversal. If price is trending higher and MFI is decreasing over that period, a market top may occur.
Presentation
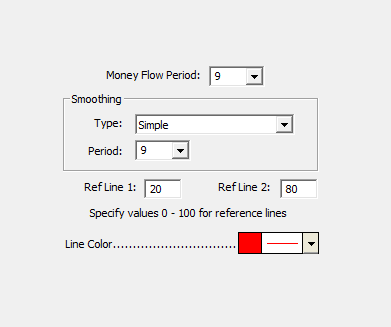
Above is an example of a Money Flow Index calculation. Let's say you have specified a period of 9, and you are adding your indicator to a 5 Minute chart. For each bar, a money flow value is calculate by multiplying the volume by the average price (HI + LO + CL) / 3. If the closing price of the bar is greater than the closing price of the previous bar, then the money flow is considered positive money flow. If the closing price of the bar is less than the closing price of the previous bar, then the money flow is considered negative money flow. If the price is unchange, the money flow is not considered in the calculation of the money flow index. The money flow index is calculated by summing up all the positive money flows into one value (PMF) and all the negative money flows into another value (NMF) over the 9 bar period, and then using these values in the following equation:
The resulting MFI is then smoothed using the smoothing parameters specified. In the case above, it is smoothed with a 9 period simple moving average. To remove smoothing, just specify a 1 period moving average. The result is always a value between 0.0 and 100.0