Home                           

 Try Investor/RT             

 Investor/RT Tour           

 Getting Started              

 What's New                  

 Testimonials                 


MASTER INDEX
  SEARCH
  CHARTS
  MAIN TOOLBAR
  SETTING PREFERENCES
  TECHNICAL INDICATORS
 
WHAT'S NEW
  ALARMS
  BACKTESTING

  CONFIRMING TRADES
  CUSTOM COLUMNS
  CUSTOM INDICATORS
  CUSTOM INSTRUMENTS
  CUSTOM PRICES
  DATA FEEDS
  DATABASE
  DOWNLOADING DATA
  FEED STATUS
  HEARTBEAT
  HELP
  MULTI-LINKING
  MULTI-PERIODICITY
 
INSTRUMENT SETUP
 
NASDAQ LEVEL II
 
NEWS TICKER
 
NEWS BROWSER
  OPTIMIZATION
  OPTIONS ANALYTICS

  PLACING TRADES
  PORTFOLIOS
  PRESETS
 
PRINTING
  QUICK QUOTES
  QUOTE PAGES
  REALIZATION
  RTL LANGUAGE
  SCANS
  SCHEDULES

  SCOPE
  SYSTEM STATUS
  TICKER TAPE
  TIME AND SALES

 
TRADING NOTES
  USER VARIABLES
  VERTICAL SCALE
MASTER INDEX
DICTIONARY
FEEDBACK

Investor/RT Tour ( more on Technical Indicators )
Volume Weighted Average Price (VWAP)
 
with Multiple Band Options
Video Demo of Volume-Driven Functionality in Investor/RT
The Formula . . . 

. . .more on Formulas 


VWAP = Sum(VOi * CLi, n) / Sum(VOi, n)

VWAP Upper Band = VWAP + Basis * Multiplier

Where:
     VOi = Volume of the ith bar of the day
     CLi = Closing Price of the ith bar of the day
     n = bars into day or session
     Basis = band basis specified in the VWAP preferences
     Multiplier = band basis multipier specified in the VWAP preferences


The Presentation . . . 

. . . more on Charts 

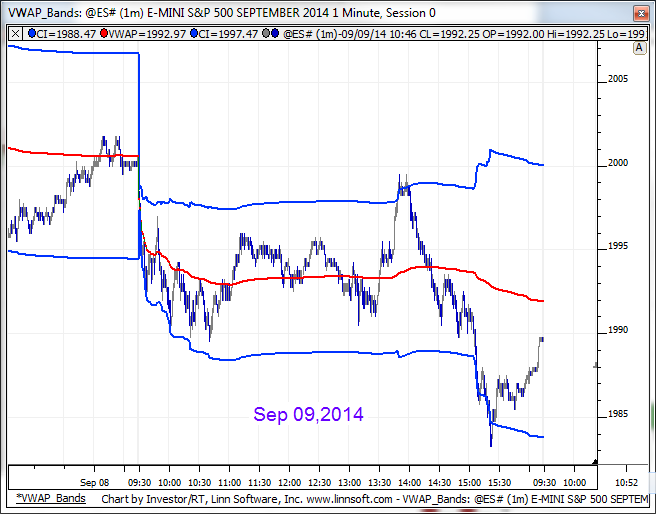
Above is a 2-minute of the S&P Mini Contract (@ESZ7, DTN IQFeed).  The VWAP is plotted overlaying the candlesticks.  Bands are drawn at 1x (blue) and 2x (red) the variance above and below the VWAP.  The preferences seen below were used in this instance.

 
The Preferences . . . 

. . . more on Preferences 

  • Draw As - Style and color used to draw the VWAP and VWAP bands (if applicable).

  • Band Basis - Several different methods are available for computing the bands, including: Variance (CL - VWAP), 1/4 Day Range, 3 x Avg Bar Range, Constant $ Value, Proprietary.  These are discussed in further detail in the description below.

  • Bands At - The user can specify 2 different band multipliers, along with the color used to draw the bands at that multiplier.

 
The Description . . .
VWAP stands for Volume-Weighted Average Price, the ratio of the value traded to total volume traded over a particular time horizon (usually one session). It is a measure of the average price a stock traded at over the trading horizon.

It's calculated by summing the price & volume of each bar or tick, over the entire session, and then dividing that by the sum of the volume for the session.

The VWAP Indicator now has options to draw one or two bands around the VWAP, as well as a variety of options for computing those bands. The options for Band Basis include:

  • Variance (CL vs VWAP) - The variance between the closing price and the VWAP line, computed on a cumulative basis from the start of the session.
  • 1/4 Days Range - One quarter of the range to that point in the day/session.
  • 3 x Avg Bar Range - Three times the average range (hi - lo) of last 20 bars..
  • Constant $ Value - A constant $ Value above and below the VWAP.
  • Proprietary - This option is a work in progress and currently being kept proprietary.
RTL Token . . .VWAPI, VWAPIU, VWAPID ( more )
The RTL Token for the Volume Weighted Average Price is VWAPI (NOT VWAP).  To access the upper band, use VWAPIU.  To access the lower and, use VWAPID.  A signal which detects price crossing above the upper band:

CL.1 <= VWAPIU.1 AND CL > VWAPIU
 

Keyboard Adjustment . . .
NA

For more information on technical indicator adjustment, click here.
 

User Strategies . . . 

If you have a User Strategy you'd like to share, please email to support@linnsoft.com