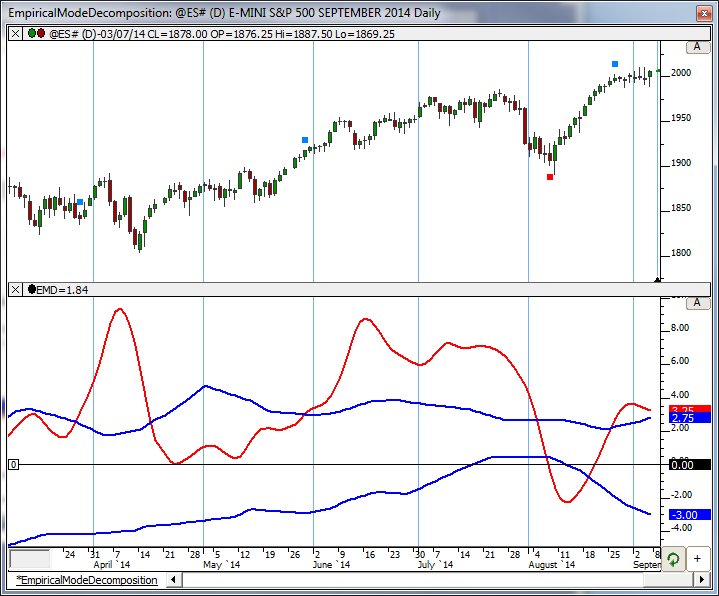
The Empirical Mode Decomposition Indicator (EMD) helps identify whether a market is in a cycle or trend mode. This indicator is discussed in the article titled "Empirical Mode Decomposition" in the March 2010 Issue of Stocks and Commodities magazine, by John F. Ehlers and Ric Way. According to the article, when the Trend Component rises above the Average Peaks, the market is in an uptrend, when it is below the Average Valleys, the market is in a downtrend, and when it's between the two, the market is in cycle mode.
The EMD indicator has 4 optional components: the Bandpass Filter (or cycle component), the Trend Component, the Average Peaks, and the Average Valleys. The inputs include price, period, delta, and fraction. The price defaults to High + Low / 2. The period should reflect the cycle period (or frequency) of the market being studied and defaults to 20 bars. The delta should be set to half the bandwidth with common values of 0.1 to 0.5. The fraction is the fraction of the average peaks and valleys used to display the upper and lower limits for the trend component. This value is subjective and can be adjusted to fit your trading style. For swing trades that prefer to trade in cycle mode, a larger fraction might be used such as 0.25.
Presentation

The chart above is a Daily chart of MSFT showing the EMD Indicator in the lower pane using the settings below.