The Keltner Channel is a volatility-based indicator which makes us of the "envelope theory" and uses the range of high and low. Moving average bands and channels, like the Keltner Channels, all fall into the general category of envelopes. Envelopes consist of three lines: a middle line and two outer lines. Envelope theory states that the price will most likely fall within the boundaries of the envelope. If prices drift outside our envelope, this is considering and anomaly and a trading opportunity. In the case of Keltner Channels, when the price touches or moves past either of the outer bands, a reaction toward the opposite band can be expected. When price reaches the upper band, it is believed to be overbought, and when price reaches the lower band, it is believed to be oversold.
Presentation

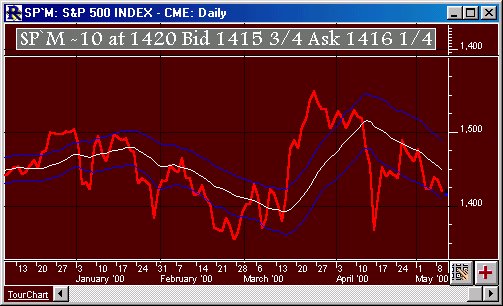
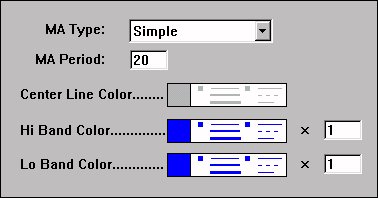
Above is a Daily Line Chart of an S&P 500 Future contract (SP) . The white line is the center line of the Keltner study, while the Blue lines represent the high and low bands, based on the preferences specified below.


