Moving averages provide different options for smoothing data. Data is smoothed in order to help reduce the effect of bar-to-bar price fluctuations and help identify longer term emerging trends. A moving average reveals the general direction and strength of a stock's price trend over a given period. The term "Moving" is used to refer to the fact that the window of bars that we are considering remain fixed in width (Period) but moves forward with subsequent bar. Some of the averaging methods however are not so much "Moving" as they are "Cumulative" (exponential for one).
The following Price options are available as the input data for each smoothing type: Open, Close, High, Low, HI+LO/2, HI+LO+CL/3, O+H+L+C/4, %Change, or OP+CL/2. In addition, the MA token can be used in RTL to smooth just about anything. For instance, if you wanted to smooth Rate of Change, you would simply use the syntax MA(ROC).
The moving average technical indicator in Investor/RT now supports nine distinct moving average types. Four new moving average types were added to Investor/RT 3.8. The Adaptive Moving Average is described in detail on p. 34 of the 1998 Bonus Issue of Stocks and Commodities Magazine, while the other 3 moving averages are described in detail in the June 1999, p. 18.

Adaptive Moving Average - This moving average moves slowly when prices are moving sideways and moves swiftly when prices move swiftly.
Triangular Moving Average - The triangular moving average derives its name from the way the weighting factors are applied to the un smoothed data. For example, for a 7 period moving average, the weighting factors are 1, 2, 3, 4, 3, 2, 1. Endpoint Moving Average - The endpoint moving average uses a least squares (linear regression) fit to derive each point on the moving average line based on the preceding period. Sine-Weighted Average - The sine-weighted moving average is similar in concept to the triangle moving average, but the weighting factors are based on a sine calculation instead. These new moving averages may be used as overlay indicators showing the moving average of some price type for an instrument, or they may be used as smoothing options in conjunction with other technical indicators. For example, the Adaptive moving average could be used to smooth the CCI, RSI, or MACD indicator.
The five pre-existing moving averages are Simple, Weighted, Exponential, Welles Wilder, and Least Square. Below we'll take a closer look at these 5 averaging methods.
Simple Moving Average (SMA) - This is probably the most commonly used smoothing type. The Simple method gives equal weighting to each price point over the period considered. Let's assume we are considering a 10-period simple average of the close. The SMA value at each bar will be computed by taking the close of that bar, and the close of the previous 9 (Period - 1) bars, adding them together, and then dividing by 10 (Period), to get the average. Each time you add a new price point to the simple MA, you drop the oldest price point. Simple MA's have a memory of only the last X bars (X being the period).
Exponential Moving Average (EMA) - Exponential averages address two problems that are experienced with Simple Moving Averages: SMAs give equal weight to each price in the period, and SMAs change twice with every new bar (new price added while old price is dropped). The calculation method used by exponential averages is cumulative, meaning that all previous bars have some effect on the EMA value, although that effect diminishes greatly with time. It is similar to other moving averages however in that the smaller the period, the more responsive the MA will be, as the most recent bar will have a greater effect.
EMAs place more weight on recent prices than other moving averages such as SMA. For example, if you choose an EMA period of 7, then the current bar is going to get a weighting factor of 2/(n+1) or 2/(7+1) in our case, which is 0.25. So the current bar will be weighted 25% while the previous value of EMA (EMA.1) will be weighted 75%. The previous value of EMA is built using each of the previous bars (or prices) to some degree. In a comparable SMA with a period of 7, the current bar and the previous 6 bars all get an equal weighting factor or approximately 14.3% and the bars preceding these 7 bars aren't considered at all. The EMA period is really less of a "period" and more of a conversion factor used in determining the weighting factor or the current bar. Larger periods apply more weighting to past bars, while smaller periods apply more weighting to the current bar (and therefore make the indicator more responsive).
Something else that must be considered when using cumulative indicators such as the EMA, is that the values can change slightly depending on how much data is loaded and considered in the population. This is inherent in the fact that each EMA value considers all past prices to some degree. So if you are using 40 bars to compute the EMA value, then the EMA value of the last bars is based on only those 40 bars, and can be different from an EMA that had 200 prior bars available for calculation. The difference in this case should be rather small and probably insignificant, but this can be an issue when running scans or using custom indicators in custom columns, as Investor/RT optimizes to load the minimum bars necessary. Charts, on the other hand, generally have many more bars at its disposal. This can account for small discrepancies between scan result values and chart values when EMAs are involved.
Beginning in version 5.4.4, Investor/RT has added the ability to allow floating point periods for exponential moving averages. Exponential Moving Average (EMA) has been added as a stand alone technical indicator, and can be reference in RTL with the token EMA. The standard moving average indicator allows only integer values to be used for the period. This new EMA allows numbers such as 2.33, 3.5, or 5.2 to be used as the period. Some traders prefer this option to allow more precise control over the weighting of the current bar.
Weighted Moving Average (WMA) - Weighted MAs share characteristics of both Simple and Exponential Averages. Like Simple MAs, WMA has a fixed window equal to the period specified. In other words, if the period is 10, then only the previous 10 bars will be considered (non-cumulative). Like Exponential MAs, WMA places more emphasis, or heavier weighting, on more recent prices. As can be seen in the formula at the top of this page, the most recent price gets a weighting factor equal to the period. The weighting factor then decreases by 1 for each of the subsequent bars all the way back to a factor of 1 for n - 1 bars back (n being the period).
For comparison, consider a 10 period moving average. For an SMA, the weighting of the current bar would be 10% (1 / 10). For an EMA, the weighting of the current bar would be approximately 18.18% (2 / [10 + 1]). For a WMA, the weighting of the current bar would be approximately 18.2% (10 / [(10 * 11) / 2]).
Volume Weighted Moving Average (VWMA) - The Volume Weighted Moving Average weights the price of each bar with the volume of that bar. In this way, bars with higher volume will be more heavily weighted in the computation of the average. For example, a 5-period VWMA first sum the product of the volume and the price for each of the last 5 bars. This product is then divided by the sum of the volumes to give the resulting average. Many indicators in Investor/RT allow the user to specify the smoothing type. The “Volume Weighted” option can now be found at the bottom of the list of smoothing types. The VWMA can also be accessed in the scan language by simply using the token “MA” and choosing for the smoothing type of the MA to be “Volume Weighted”.
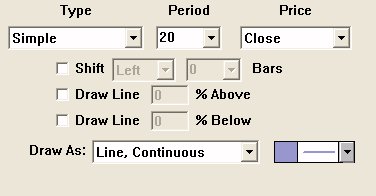
The Moving Average (MA) and Exponential Moving Average (EMA) indicators have been enhanced by providing options for drawing type. This enhancement will open up MA and EMA lines to be drawn as Two Color Lines, Stepped Lines, and Histograms. These advanced drawing type options, which already exist in a number of indicators including Custom Indicators, will be rolled out to many others in the near future. If an indicator currently does not support these drawing options, it still may be possible to implement the drawing of this indicator by first create a Custom Indicator that simply represents the indicators value. The drawing types are then available to Custom Indicators. RTL Token . . . MA ( more )
The Moving Average indicator can be referenced in RTL using the token: MA. In addition to the price options available within the MA preferences, the MA token can be used in RTL to smooth just about anything. For instance, if you wanted to smooth Rate of Change, you would simply use the syntax MA(ROC). In this syntax, MA will ignore the price option specified in the preferences and just use the ROC values as input to the smoothing type (and period) specified. The floating point Exponential Moving Average indicator, which allows floating point periods, can be references using the token EMA.
Presentation


Above are two Daily Candlestick Charts of an QQQ (Nasdaq tracking stock). The daily bars are replicated 14 times, with a different 20-period moving average overlaying the bars each time. The moving average type is labeled above the bars/lines.
Formula
Keyboard Adjustment
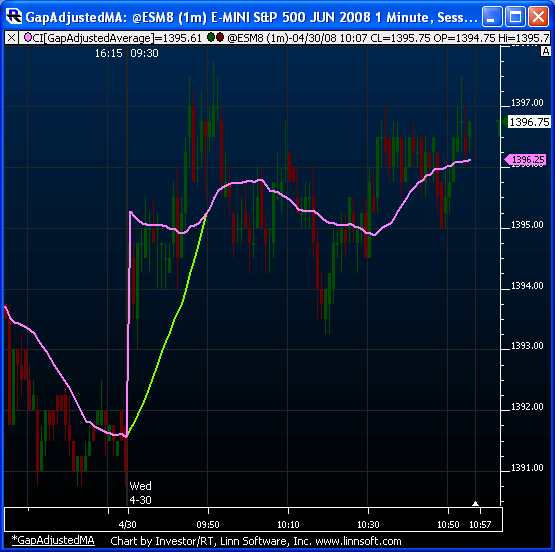
Several preferences of the MA indicator can be adjusted directly from they keyboard without opening up the preference window. First, select the indicator, then use the up and down arrow keys to adjust the smoothing period up or down by 1. To adjust the smoothing type, hold down the shift-key while hitting the up or down arrow keys. It's easy to keep track of the smoothing type by looking at the feedback in the title pane for MA. To adjust the thickness of the MA line, hold down the Ctrl key while hitting the up or down arrow keys. To adjust the floating point EMA indicator, the up and down arrows should also be used. The period is adjusted in increments of 0.1. User Strategies . . . Mike Derr 02/28/02 For user strategies I will submit simple buying and selling of MA crosses and buying and selling MA slope changes. Buy MA Cross MA_Short1 < MA_Long1 AND MA_Short > MA_Long - MA_Short - MA token renamed (Shorter Period) - MA_Long - MA token renamed (Longer Period) Sell MA Cross MA_Short1 > MA_Long1 AND MA_Short < MA_Long - MA_Short - MA token renamed (Shorter Period) - MA_Long - MA token renamed (Longer Period) Buy MA Slope Change Up MA > MA.1 AND MA.1 < MA.2 Sell MA Slope Change Down MA < MA.1 AND MA.1 > MA.2 Toby Zidle 02/28/02 As an investor with a longer-term outlook (weeks/months), I find that MA crossovers are generally useless for timing. I look at 20-day exponential, 50-day simple, and 200-day simple averages. The 20-day average is generally pretty good as a support baseline on upward trends and resistance on downward trends. But by the time it crosses the 50MA, it's far too late in the cycle to be a meaningful signal. Too much of the "move" has already happened. Perhaps I need to be looking at something like 5/13 MA crossovers. I don't know. I've already gone off in a different direction to look for my signals. Neal DaMommio 02/28/02 Chart Example I keep a 200 period MA on my 3-minute and 1-minute charts & use them as support and resistance. I don't use them as a trigger but love to use them as confirmation or even stops. I was watching KLAC today and the 200 period on the 3 minute confirmed two of my shorts. I put more faith in the 3 minute vs. the 1-minute. I also keep a 200, 50 and 20 Day MA (the 20 is exponential) on my 13-minute chart. I use the IRT variables to accomplish this. I really use these to tell me when not to trade instead of when to trade. There is a popular 5/8 moving average crossover trigger that short-term traders use. I think the 5 is exponential and the 8 is simple. It's used on charts from 60 minutes on down. The theory is to stay short or long on the stock at all times. When the 5 crosses below the 8 go short and when it crosses above the 8 close the short position and go long. To give themselves a bit of an edge the traders backtest a group of stocks & choose the ones that this system has worked well on in the last couple of weeks. I looked at this system at one time but didn't like the way it performed. Here is a jpg of today's 3-minute chart of KLAC with the two 200MA resistance areas circled.