The Parabolic SAR, developed by Welles Wilder, is used to set trailing price stops. SAR refers to "Stop-And-Reversal". It is designed to create exit points for both long and short positions in such a way that it allows for reactions or fluctuations at the beginning of the position, but accelerates upward (for long positions) or downward (for short positions) as the movement tops out. Parabolic SAR is plotted around the price chart similar to a moving average. The Parabolic SAR provides excellent exit points. Wilder suggests using this indicator in a trending (or directional) market. If the security is trending up, then one might only take long positions. If the security is trending down, one might only take short positions.
A common system for trading the SAR is to go long when the SAR crosses below the close. This condition can be detected using the following scan or trading signal:
SAR < CL AND SAR.1 >= CL.1
And to reverse the long position and go short when the SAR crosses back above the closing price:
SAR > CL AND SAR.1 <= CL.1
Presentation

Above is a 15-Minute Candlestick Chart of Microsoft Corporation (MSFT) . The red dots overlaying the candles represents the Parabolic SAR levels using the preferences below. The green up arrows represent bullish SAR reversals, while the red down arrows represent bearish SAR reversals (both Scan Markers). In the lower pane, the SAR is drawn as an oscillator.
Formula
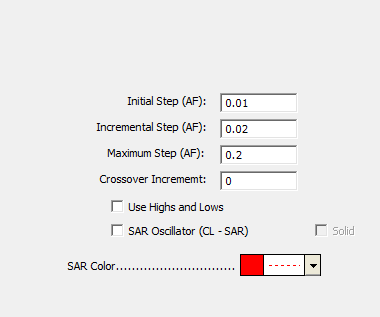
Keyboard Adjustment
Both steps (initial and maximum) involved in the SAR indicator can be adjusted directly from they keyboard without opening up the preference window. First, select the indicator, then use the up and down arrow keys to adjust the Initial/Incremental Step up or down by 0.001. To adjust the Maximum Step up or down by 0.01, hold down the shift-key while hitting the up and down arrows.