Signal Statistics (SSTAT)
The Signal Statistics indicator (SSTAT) enables statistical calculations on any signal, including summation of consecutive signals, frequency, returning various metrics at or since the last signal (or Nth Signal Ago), MAE/MFE metrics, and more. The available statistics can be split into 2 categories:
- A first category of SSTAT outputs is computed solely from existing data, i.e. the ongoing and past bars data. Within that category, either multiple past signals are involved in the statistics computation (i.e., the sum of consecutive signals), or the computation specifically refers, for a given bar, to a single signal, which can be either the last Signal (i.e. Highest Price since the Last Signal) or refer to the Nth signal back (for example, the Price 3 Signal back). Such statistics involve bars that have occurred since that specific signal, with the corresponding output value resetting at every bar that returns a true signal. In this first category, the SSTAT indicator returns a computed value for every bar.
- A second category of statistics consists of "look-ahead" results, which are typically used for "after-the-fact" analysis, as their computation requires peeking into "future" data. With such outputs, you can analyse how a long/short trading signal bar would perform over a specific period of time (without having to create any kind of trading system). A first set of output (such as Price until Next Signal) is computed for every bar, as they do involve computation based on both past and future data. A second set of forward-looking SSTAT outputs returns values only for bars that produce a true signal, with their computation relying entirely on look-ahead data.
The following table summarizes for each of these categories the different available outputs. Other than the required "Signal" formula to be selected among the ones available in your database, it lists the additional inputs (if any) required for each output (as discussed in more detail in the Preferences Tab)
A specific SSTAT output can be drawn directly using various indicator styles (such as histograms and multiple line types). But in the vast majority of cases, this is the corresponding SSTAT token, which is used in the syntax of a signal or custom indicator formula.

The most frequently used statistics are highlighted in Bold.
Presentation

Above is a 4 tick renko chart of the S&P Emini Contract. The Signal Statistics indicator is drawn as a histogram in the lower window pane, using the output settings as highlighted in the Preferences tab: "Sum of all Consecutive Signals" with the Signal being CL > CL.1 (ie detecting a bar up), and the option "Subtract -1 for false Signal being checked). In the case of a renko chart (where each bar is either up or down), this SSTAT output effectively creates a "Renko Chart Bar Counter" that computes the number of consecutive bars up (increasing positive values) or down (increasing negative values).
Keyboard Adjustment
The period involved in the SSTAT indicator can be adjusted directly from they keyboard without opening the preferences window. First, select the indicator, then use the up and down arrow keys to adjust the period up or down by 1. The period is only relevant to certain results (Frequency Over Recent Period, Percent Of Recent Period, and Profit/Loss - Look Ahead).

- Signal - Signal which will be used as the basis of the statistical result. When the underlying signal is modified and saved, the updated results will be seen immediately in the corresponding display.
- New - Click this button to create a new RTL signal formula.
- Edit - Click this button to review / edit an existing signal formula.
- Result: The available outputs are discussed in the list below (which follows a category breakdown that differs from the order available in the pop up list). Each output may have a different variety of additional inputs required, such as a "Price" type, a lock back or look ahead Period (expressed as a number of bars) or a number N of signals back/forward (in case the signal considered for the statistics is not the "last" one or "next" one)
The other preferences are similar to the ones which can be found with a standard "Custom Indicator"
- Evaluate/Display Last X Values -This setting dictates how many bars will be considered in the evaluation of the signals and the calculation of the statistical results. The default is ALL, but a value of 50 means only the most recent 50 bars will be displayed. It also accepts dual inputs such as ALL:ALL, which is the recommended setting for all look-ahead outputs. As discussed in this forum post, an ALL:ALL (or ALL:100) setting is also required to update certain forward-looking RTL formulas, such as those with tokens related to the Fractals or ZigZag Oscillator indicators, or those that use the FREF RTL functions. SSTAT look-ahead outputs fall into this category. Indeed, the computation of past bars (i.e., RTL tokens value) may be modified based on the value of future bars. This dual-input feature forces the recalculation of the past bar formula upon the value of the most recent bars.
- "Draw As" selection box offers the same panel of histogram (recommended for most non-price related output results) or line styles, together with an optional Reference line may be drawn at a user-specified level.
- Set Current Value into Variable: You have the option to store the spot value of an SSTAT indicator into a V# or C# variable.
Part 1) Statistics based on a single or multiple past signals
1.1) Statistics involving multiple past signals
- Sum of Consecutive Signals - This result will give the number of consecutive signals that have occurred, whether TRUE or FALSE signals. For instance, a value of +7 represents 7 consecutive TRUE signals. If the underlying signal is CL > CL.1, then this +7 value represents 7 consecutive increasing closes. There is also an option for "Subtract 1 for FALSE Signals". If this option is not checked, the result will always be positive (1 for a signal bar, 2 for 2 consecutive bar up, etc), and will just be reset to 0 when a FALSE signal occurs. If this option is checked, each consecutive FALSE signal will subtract 1 from the result. In that case, when the signal first changes from FALSE to TRUE, the result is always 1, and will then build with each consecutive TRUE signal. When the signal changes from TRUE to FALSE, the value will be -1 and each consecutive FALSE signal will continue to build in the negative direction (If "subtract" is unchecked, each FALSE signal will keep the result at 0 until a TRUE signal gets things going back into the positive direction).
- Sum of All Signals - This result works exactly as the "Summation of Consecutive Signals" option discussed above, except that the result does not reset when the signal reverses. In other words, if the result is currently +7, and a FALSE signal occurs, then the result becomes either +6 or +7, depending on whether the "subtract" option is checked, whereas the result would have become either -1 or 0 with the "Consecutive" option.
- Sum Of Session Signals (Intraday) - It is strictly similar to "Sum of All Signals", except that the result will systematically reset to 0 at the beginning of each session (This result only applies to intraday charts/data).
- Running Total - This option keeps a running total of both the TRUE and FALSE signals. If a TRUE signal occurs, the result will be a positive number representing the total number of TRUE signals that have occurred as of that bar, including that bar. If a FALSE signal occurs, the result will be a negative number representing the total number of FALSE signals that have occurred as of that bar, including that bar.
- Frequency Over Recent Period - When this result option is selected, a "period" preference is presented. The result is the number of times the signal is TRUE over the specified period. For instance, if the period was 20 and the result was 5, this would indicate that the signal was TRUE for 5 of the previous 20 bars and FALSE for the other 15.
- Percent Of Recent Period - This option is similar to the "Frequency Over Recent Period" option, except it returns a percentage of bars for which the signal hit TRUE. For instance, if the period was 40, and the result was 20%, this would indicate that 20% of the 40 bars (or 8 bars) were TRUE, while 80%, or 32, were FALSE.
- Percent Of All Bars - This option gives a result that represents the percentage of all previous bars, including the current bar, for which the signal was TRUE. When viewing this indicator in a chart, each bar, moving right, will be considering one additional bar than the bar to it's left. And the rightmost (current) bar in the chart will take into account all past bars. Each bar considers itself and all bars to its left. The number of bars in the chart is dictated by the "Viewing Period" setting in the Chart Preferences.
- Sum of Price of All Signals - This option is similar to the Sum of All Signals, except that the summation involves the selected "price" value of each signal bar
- Average of Price of All Signals - Similar to the previous option, except the average of the Price of each Signal is calculated.
1.2) Statistics related to a single signal (the last one or the Nth Signal back))
- Bars Since Last Signal (resp. N Signal Ago) - This result option gives the number of bars since the last signal (resp since N signal ago) hit TRUE. This result is always positive or 0. A value of 0 means the RTL signal formula returns true on the current bar (or that a TRUE signal hasn't occurred yet). A value of 12 means that the signal last hit TRUE 12 bars back, followed by 11 bars of FALSE signals.
- Seconds Since Last Signal - This result option is similar to "Bars Since Last Signal", but, instead of the number of bars, it returns the number of seconds since the last signal bar.
- Price At Last Signal (resp. N Signal Ago) - This result gives the closing price of the bar on which the last signal (resp Nth signal ago) was TRUE. This result changes only when a TRUE signal occurs and then remains constant across FALSE signals. This option could be useful for trading signals when combined with the "Bars Since Last Signal" option.
- Price Before/After Last Signal - This result works identically to "Price At Last Signal", except a period is provided to allow access to the price of bars before or after the signalled bar. A period of 0 will make this result identical to "Price At Last Signal". A period of 10, for instance, will cause the result to be the price of the 10th bar preceding the signalled bar. A negative value may be specified to access bars following the signalled bar. For instance, a period of 5 with a price of "High" would result in the high of the 5th bar following the signal. The result will only change bars that signal TRUE, and then hold that value until the next signal.
- Highest Price Since Signal (resp. N Signal Ago) - This result gives the highest price that has been realized since the last TRUE signal (resp. Nth signal ago). This result can only increase between signals. If the High of the bar is selected as "Price", on the signalled bar, the result will be the high of that bar. If the high of the following bar is higher than that high, then the result will increase to this new high. This will continue until the next signal hits, at which point the result will be reset to the high of the newly signalled bar.
- Lowest Price Since Signal (resp. N Signal Ago) - This result gives the lowest Price that has been realized since the last TRUE signal (resp. Nth signal ago). This result can only decrease between signals. If the Low of the bar is selected as "Price", on the signalled bar, the result will be the low of that bar. If the low of the following bar is lower than that low, then the result will decrease to this new low. This will continue until the next signal hits, at which point the result will be reset to the low of the newly signalled bar.
- Bars From (Last) Signal To Highest Price - This result gives the number of bars from the signal to the highest price since the signal. This may be useful in identifying divergence (if the "Price" input selected is the cumulative delta, for example)
- Bars From (Last) Signal To Lowest Price - This result gives the number of bars from the signal to the lowest price since the signal. This may be useful in identifying divergence.
- Change Since Last Signal - This result gives the change in price (The Close of the bar is considered) since the last TRUE signal occurred. This value will become 0 when a TRUE signal occurs, and then will build in either direction on FALSE signals as the price changes since the last TRUE signal.
- Maximum Profit Since Signal - The maximum potential gain based on the highest high achieved since the signal occurred relative to the Close price of the entry bar (e.g, the last signalled bar). This result provides a value on each bar following the signal, and resets at each signal.
- Maximum Loss Since Signal - The maximum potential loss based on the lowest low achieved since the signal occurred relative to the entry price on the signalled bar. This result provides a value on each bar following the signal, and resets at each signal.
Remarks:
- A price input is available for most of the above outputs. It is not needed for the first 2 results (Bars since / seconds since Last Signal) and not available for the last 3 results (that involve only Close or High/Low bar data). A Price input can also be a "Custom Price"
- "N Signal ago" feature: N=1 does return an output similar to "Last Signal". N=4 will refer to the 4th signal back.
- "Bars Since Last Signal" and "Highest/Lowest price since last signal" are also available, for intraday chart only, with the variants: "Bars Since Last Signal or Session start" and "Highest/Lowest price since last signal or Session Start". For such outputs, the bar marking the start of the session will be used for statistical computation if the last signal occurred in the previous session. Such a result could have also been obtained by using as Signal "SIGNAL=TRUE or POS=1" with POS the position token corresponding to "Bars from Start of Session"
Part 2) "Look-Ahead" Signals Statistics outputs (peeking into the future to analyze trading signals)
2.1) SSTAT outputs returning a value for every bar, resetting at each new signal
- Bars until next Nth Signal - For every bar (including the Signal bar), the indicator looks forward and returns the number of bar until the next Nth signal bar. If no signal is detected ahead, it returns a zero value.
- Price at next Nth Signal - For every bar (including the Signal bar), the indicator looks forward and returns the Price of the next Nth signal bar. If no signal is detected ahead, it returns a zero value.
- Highest High until next Nth Signal - For every bar (including the Signal bar), the indicator looks forward and returns the Highest High until the next Nth signal bar. If no signal is detected ahead, it returns a zero value.
- Lowest Low until next Nth Signal - For every bar (including the Signal bar), the indicator looks forward and returns the Lowest Low until the next Nth signal bar. If no signal is detected ahead, it returns a zero value.
2.2) Look ahead SSTAT outputs returning only a value for TRUE signal bars
- Profit/Loss - Look Ahead - This option, like all the ones in this section, lets you peek into the future to see how your signals would perform over a specific period. For each TRUE signal, this result uses the specified period to calculate a look-ahead profit/loss value (for a Long position) based on the entry and exit prices corresponding to the CLOSE value of the look ahead bar. For instance, if the period was 20, then each time a TRUE signal occurred, the result would be the price 20 bars ahead, minus the price of the current signal bar. If there are insufficient bars ahead of the signalled bar, then the profit/loss will be computed based on the last bar (price of last bar minus price of signalled bar).
- Short Profit/Loss - Look Ahead - This result works the same as the "Profit/Loss - Look Ahead" option, except the profit is based on a short trade. In other words, a decrease in price results in a profit, while an increase in price results in a loss.
- Max Favorable Excursion - Look Ahead - For a simulated long position that would have been entered at the Close price of the Signal bar, this result looks ahead from the signal bar, based on the period specified, and finds the maximum potential gain experienced over that period, based on the highest high quotes reached during the period. If the look-ahead period is 5, MFE equals the highest high quotes among the 5 bars following the signal bar minus the Close price of the Signal bar. This result appears only on the signalled bars, showing a value of 0 on all other bars.
- Max Adverse Excursion - Look Ahead - For a simulated long position that would have been entered at the Close price of the Signal bar, this result looks ahead from the signal bar, based on the period specified, and finds the maximum potential loss experienced over that period, based on the lowest low quote reached during the period. If the look-ahead period is 5, MAE equals the Close price of the Signal bar minus the lowest quotes among the 5 bars following the signal bar. This result appears only on the signalled bars, showing a value of 0 on all other bars.
- MFE Period (Bars to MFE) - This result shows how many bars forward from the signal at which the MFE (Maximum Favorable Excursion) price was reached. In other words, it represents how many bars from the signalled bar that the highest high occurred over the period specified.
- MAE Period (Bars to MAE) -This result shows how many bars forward from the signal at which the MAE (Maximum Adverse Excursion) price was reached. In other words, it represents how many bars from the signalled bar that the lowest low occurred over the period specified.
- Bars Until Target - This result requires 3 inputs: a target expressed as a number X of ticks, a Price input and a "Period". If one considers "High" as price, for a simulated long position (entered at the Close price of the Signal bar), this output returns the number of bars until the High (of a future bar) hits the target price (defined as the Close of the Signal bar plus X ticks), knowing that this SSTAT output does return zero if the number of bars is higher than the "Period" value or if the target price is never reached.
- Bars Until Stop - This result requires 3 inputs: a stop level expressed as a number X of ticks, a Price input and a "Period". If one considers "Low" as price, for a simulated long position (entered at the Close price of the Signal bar), this output returns the number of bars until the Low (of a future bars) hits the stop price (defined as the Close of the Signal bar minus X ticks), knowing that this SSTAT output does return zero if the number of bars is higher than the "Period" value or if the stop price is never hit.
 |
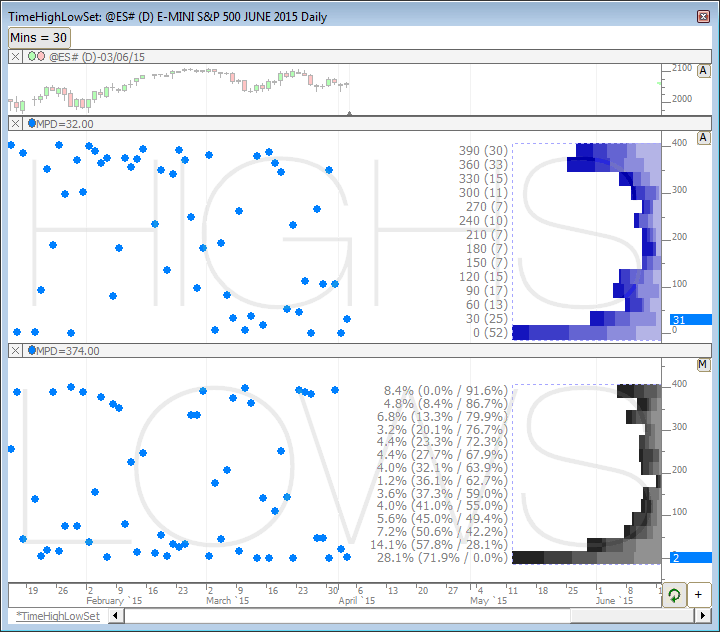
This chart is documented in the Profiles On Indicators article. The TimeHighLowSet chart extracts the time into the session that the high and low was set/completed. The profile indicator then... Read more Download
|
 |
Hi, Read more
|
|
|
Hi, I'm trying to calculate stats not on one symbol but for portfolio. Lets say I want to count gaps bigger then x percent.
I built a Signal and used it with Signal Statistics to get result for one symbol. In my case I want to calculate more variables and for many symbols at once.
Read more
|