Home                           

 Try Investor/RT             

 Investor/RT Tour           

 Getting Started              

 What's New                  

 Testimonials                 


MASTER INDEX
  SEARCH
  CHARTS
  MAIN TOOLBAR
  SETTING PREFERENCES
  TECHNICAL INDICATORS
 
WHAT'S NEW
  ALARMS
  BACKTESTING

  CONFIRMING TRADES
  CUSTOM COLUMNS
  CUSTOM INDICATORS
  CUSTOM INSTRUMENTS
  CUSTOM PRICES
  DATA FEEDS
  DATABASE
  DOWNLOADING DATA
  FEED STATUS
  HEARTBEAT
  HELP
  MULTI-LINKING
  MULTI-PERIODICITY
 
INSTRUMENT SETUP
 
NASDAQ LEVEL II
 
NEWS TICKER
 
NEWS BROWSER
  OPTIMIZATION
  OPTIONS ANALYTICS

  PLACING TRADES
  PORTFOLIOS
  PRESETS
 
PRINTING
  QUICK QUOTES
  QUOTE PAGES
  REALIZATION
  RTL LANGUAGE
  SCANS
  SCHEDULES

  SCOPE
  SYSTEM STATUS
  TICKER TAPE
  TIME AND SALES

 
TRADING NOTES
  USER VARIABLES
  VERTICAL SCALE
MASTER INDEX
DICTIONARY
FEEDBACK

Investor/RT Tour ( more on Technical Indicators )
True Strength Index
The Formula . . . 

. . .more on Formulas 

TSI = NUM / DEN
where
NUM = MA(MA(Mom, Exp, Long, m), Exp, n)
DEN = MA(MA(AbsMom, Exp, Long, m), Exp, n)
Mom = PRICE - PRICE.1
AbsMom = ABS(PRICE - PRICE.1)
m = Long Term
n = Short Term
 
The Presentation . . . 

. . . more on Charts 

True Strength Index

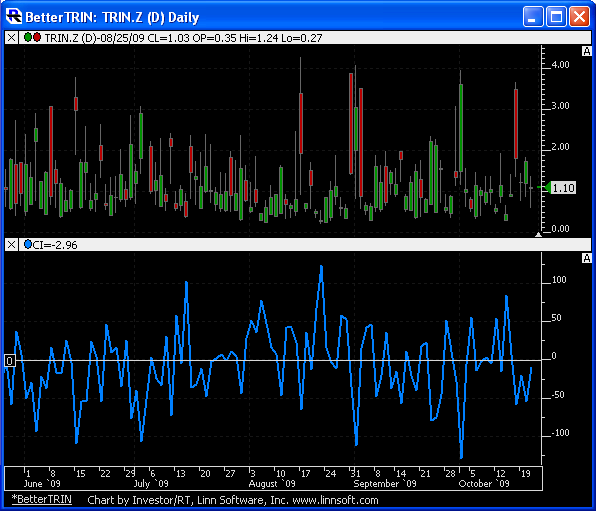
Above is a 5 Minute Bar Chart of America Online (AOL).  The bold blue line in the lower window pane represents the true strength index, as specified in the preferences below.

 
The Preferences . . . 

. . . more on Preferences 

True Strength Index Preferences

  • Short Term - Second Period used in the double exponential smoothing of momentum.

  • Long Term - First Period used in the double exponential smoothing of the momentum.

  • Price - Price used as input for the calculations seen above.

  • Line Color - Color of the TSI line in the chart.

 
The Description . . .
True Strength is a variation of the Relative Strength indicator. It uses a double smoothed exponential moving average of price momentum to eliminate choppy price changes and spot trend changes. This indicator has little or no time lag. An increasing True Strength value indicates increasing momentum in the direction of price movement.