The Fibonacci Retracement / Expansion study is a very flexible tool in Investor/RT, allowing for drawing of both retracement and expansion lines, based on either price (horizontal), time (vertical), both. The Fibonacci trendline endpoints can be automated, can be user specified, can snap to extreme prices, or can even be set automatically to any custom value using a scan. Over 16 custom retracement/expansion levels can be drawn with each instance of the study. The price retracements can be based on either % levels, or absolute price ($).
Fibonacci Retracements are displayed by first drawing a trendline between two extreme points, for example, a trough and opposing peak. A series of 8 or more horizontal lines can be drawn intersecting the trendline at the Fibonacci levels of 0.0 percent, 23.6 percent, 38.2 percent, 50 percent, 61.8 percent, 100 percent, 161.8 percent, 261.8 percent, or whatever custom levels you prefer. Levels can be specified in unit of % or $. After a significant move, (either up or down), prices will often retrace a significant portion (if not all) of the original move. As prices retrace, support and resistance levels often occur at or near the Fibonacci Retracement levels.
A new checkbox (labeled "$") in the lower right hand corner of the Fibonacci Retracement preference allows the user to setup the study to use absolute price retracements as opposed to % retracements. Typically, the Fibonacci retracement interprets the levels as % levels on which to draw retracement lines. With the absolute price retracement option checked, the retracement lines will be drawn at absolute price distances from the endpoint. This option in combination with the Price Projection option gives the user to draw multiple horizontal reference lines at specific price levels throughout the chart.
Fibonacci Retracements now maintain their high or low prices and positions properly when switching periodicities, regardless of the price sources specified. In the past, when using the "Use Bar" option, switching intraday periodicities could sometimes result in slightly altering the price of the endpoints. Now, when switching from a 10-minute chart to a 1-minute chart, for instance, the endpoints will maintain their high and low positions, and attach themselves to the proper 1-minute bars which contain those highs and lows. Switching back to a 10-minute chart will again maintain the original 10-minute prices and endpoints.
Retracement Price Source - The user has a great deal of flexible automation available in determining the endpoints of the retracement trendline. Four options are available. The "Use Bars" option allows the user to specify the date/times of the bars that will be used for the retracement trendline. The prices will be determined based on the high of the higher bar, and/or the low of the lower bar. When dragging and dropping, the endpoints will snap to the high or low of the bar on which it is dropped. "Use Price" allows the user to use specific prices as trendline endpoints, independent of the highs and lows of the actual bar data. This option should be specified if the user wants complete flexibility over where the endpoints can be dragged and dropped. "Use Variables" allows the user to link the trendline endpoints to different variables, including the High and Low of the day, or any of the custom V# variables. By giving the user access to the V# custom variables, the user may set the endpoints to essentially any data accessible using RTL. "Automatic Retracement Using last X bars" provides for an auto-fib retracement capability and is discussed further below.
Automatic Fibonacci Retracments - If you select the "Use last X bars" option, then your Fibonacci trendline becomes automated and can then change dynamically as new prices come into the chart. The Fibonacci trendline will be drawn from the highest high over the period specified to the lowest low, and the resulting retracement levels will then be draw respectively. The trendline, and thus the retracement levels, can change with each new tick and each new bar. The Begin and End date-times will be ignored in this situation, as the indicator always be based on the most recent period of bars. As a new bar comes into the picture for consideration, an old one is no longer considered.
Presentation

Above is a Daily Chart of an Microsoft Corporation (MSFT). The diagonal red line represents a trendline between two extreme points, based on the date-time ranges specified below. The horizontal trendlines represent the Fibonacci Levels selected in the preferences below.
Keyboard Adjustment
The keyboard can be used to move the Fibonacci points to the right and left. First, click on the chart. Then hit the tab key repeatedly until you notice your Fibonacci Retracement lines are selected. Then, press the right or left arrow keys on your keyboard to move the entire Fibonacci line right or left one bar. To move the trendline up or down, press the up and down arrows on the keyboard. If you would like to move only the endpoint, then hold down the Ctrl key while pressing the right or left arrow keys. If you would like to move only the beginning point, then hold down the Shift key while pressing the right or left arrow keys.
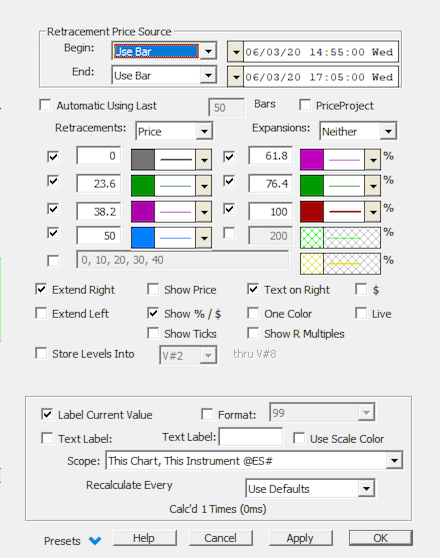
 - Dictates whether that retracement level will be draw in the chart. The last and longest entry box allows the user to enter comma or space delimited numbers for additional retracement levels.