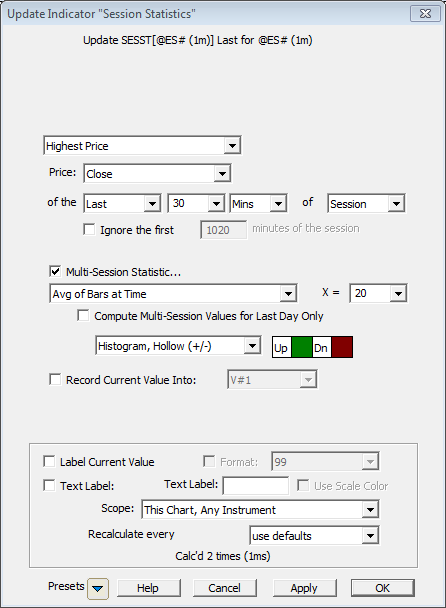
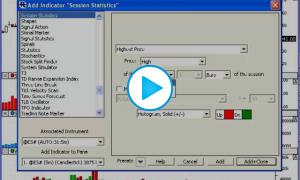
|

MASTER INDEX
SEARCH
CHARTS
MAIN TOOLBAR
SETTING PREFERENCES
TECHNICAL
INDICATORS
WHAT'S NEW
ALARMS
BACKTESTING
CONFIRMING TRADES
CUSTOM
COLUMNS
CUSTOM
INDICATORS
CUSTOM
INSTRUMENTS
CUSTOM PRICES
DATA FEEDS
DATABASE
DOWNLOADING
DATA
FEED STATUS
HEARTBEAT
HELP
MULTI-LINKING
MULTI-PERIODICITY
INSTRUMENT SETUP
NASDAQ LEVEL II
NEWS TICKER
NEWS BROWSER
OPTIMIZATION
OPTIONS
ANALYTICS
PLACING TRADES
PORTFOLIOS
PRESETS
PRINTING
QUICK
QUOTES
QUOTE PAGES
REALIZATION
RTL LANGUAGE
SCANS
SCHEDULES
SCOPE
SYSTEM STATUS
TICKER
TAPE
TIME AND SALES
TRADING NOTES
USER VARIABLES
VERTICAL SCALE
MASTER INDEX
DICTIONARY
FEEDBACK
Indicator-A-Day
24.
Volume Breakdown
23. PriceTime
Cycles
22. Trend
Intensity Index
21. Bollinger
Bands
20. Balance
of Power
19. RSI
18. Fib
Retracements
17. Parabolic
SAR
16. CCI
15. ADXR
14. ADX
13. DI+
/ DI-
12. True
Range
11. Stochastics
10. Statistics
9. TLB
Oscillator
8.
Weighted
MA
7.
Exponential
MA
6. Moving
Average
5.
Regression
Review
4.
Reg
Acceleration
3.
Regression
Slope
2.
Regression
Bands
1.
Linear Regression
|
Investor/RT Tour
( more on Technical
Indicators )
Session Statistics (SESST)
Video
Demo of Session Statistics
- Average Volume of Time Periods
Video
Demo of Session Statistics
- Average for Day of Week & Projecting Volumes
| The Formula
. . . |
. . .more
on Formulas |
| See Description Below
|
| |
| The
Presentation . . . |
. . . more
on Charts |
|

Above is a 5-minute Bar Chart of an Microsoft
Corporation (MSFT). The Session Statistics indicator has been
added twice to the chart, once showing the highest high of the first
30 minutes of each session (using preferences seen below), and once
showing the lowest low of the first 30 minutes of the session. |
| |
| The
Preferences . . . |
. . . more
on Preferences |
|
 |
-
Statistic - Options include "Highest
Price", "Lowest Price", "Range of Price", "High/Low Range",
"Average Price" and "Sum of Price", with Price being whatever
price is specified below.
-
Price - Price used in calculating the
result.
-
of the First/Last X Mins/Bars - A period
can be specified, in either minutes or bars, and over either the
start (First) or end (Last) of the session.
-
Multi-Session Statistics - When this
checkbox is selected, a list of multi-session statistics is also
presented, providing options of "Average of X Sessions", "Sum of
X Sessions", "Max of X Sessions", "Min of X Sessions", and
"Value X Sessions Back", with an area where "X" is specified (as
the lookback period).
-
Draw Type - The
result may be drawn as a Histogram (solid, hollow, or custom) or a Line
(continuous, connected, stepped, or two-color). Histograms are recommended for
most results.
-
Color and Style
- The result can be drawn in any color. If the result
is drawn as a histogram, two colors will be presented (one for
Up and one for Down). If the result is a line, the color,
style, and width may be chosen.
|
| |
|
The
Description . . . |
Session Statistics Indicator
A Session Statistics indicator has been added to give the user an easy
way to historically access statistical information related to the
first or last period of the session. The Session Statistics
preferences use the general format:
[Statistic] of [Price] of the [First/Last] X [Minutes/Bars] of the
Session
The Statistic options include "Highest Price", "Lowest Price", "Range
of Price", "High/Low Range", "Average Price", or "Sum of Price". The
standard list of Prices is provided (Close, High, Low, Open, OHLC/4,
etc.).
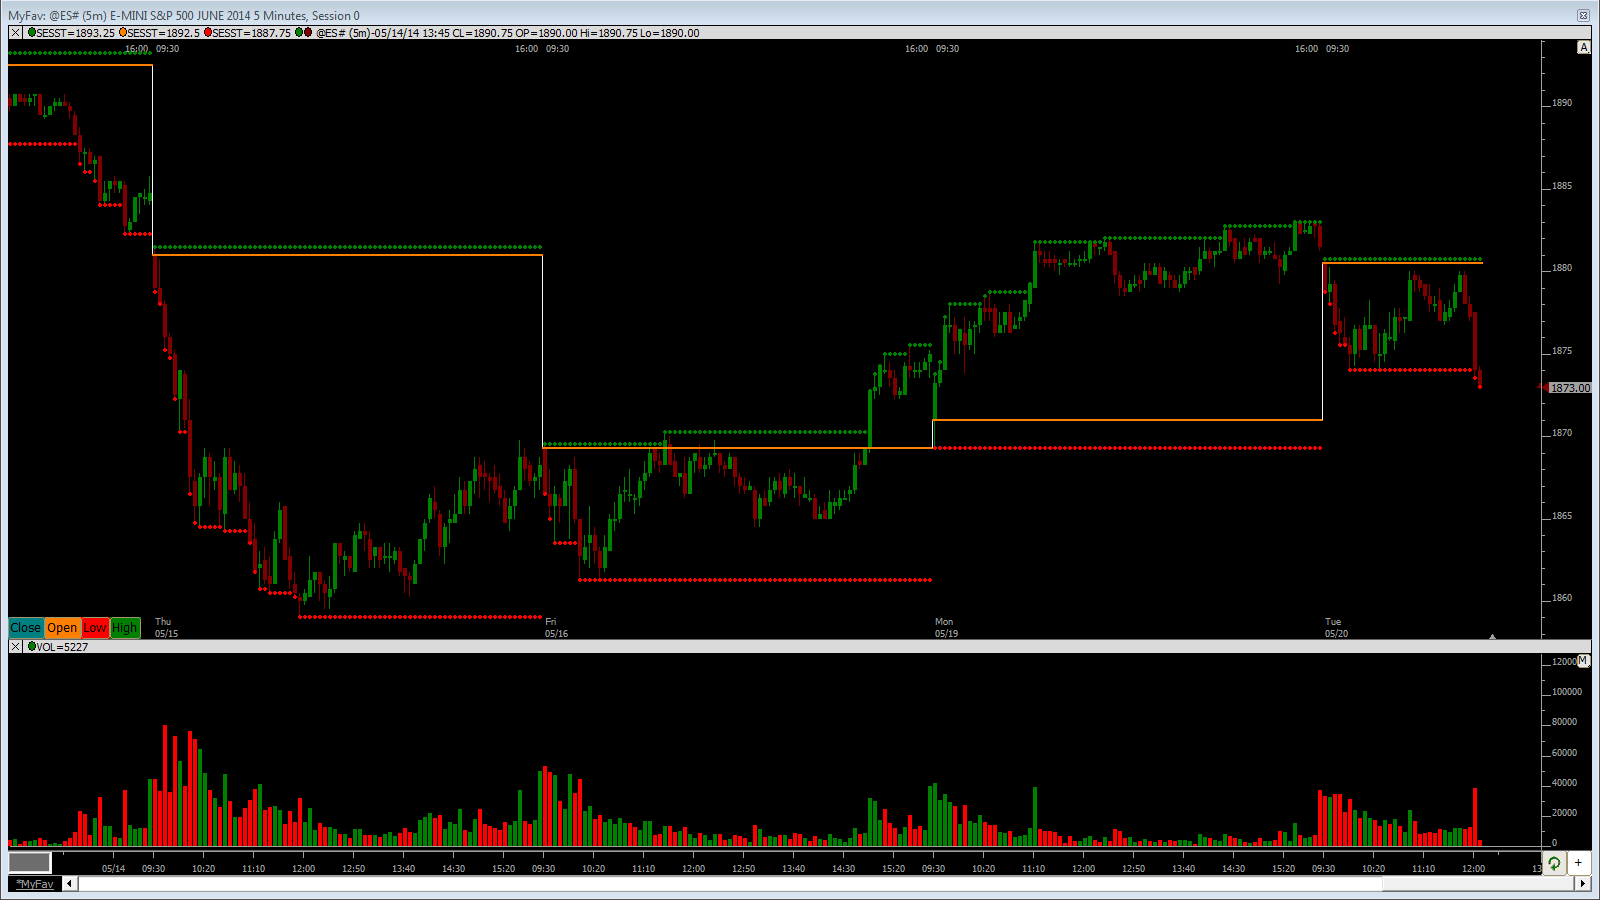
As an example, a user may want to access the "Highest High of the
First 30 Minutes of the Session". This indicator makes that operation
very quick and easy. The result will be as follows. Let's assume in
our example we are looking at 10-minute data. On the first bar, the
result will be the high of that first bar (first 10 minutes). On the
second bar, the result would be the highest high of the first two bars
(first 20 minutes). Then, on the third and remaining bars of the
session, the result would be the high of the first 3 bars (first 30
minutes). Then on the first bar of the following session, the result
will again reset to the highest high of that first bar, and everything
starts over again. To see the effect, simply add the indicator to a
chart. |
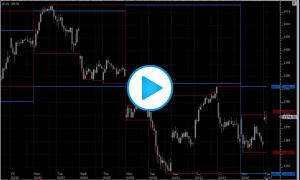
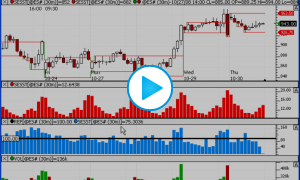
| |
|
RTL Token . . . SESST ( more
) |
|
The Session Statistics indicator result can be accessed in the RTL
language with the token SESST.
|
|
Keyboard
Adjustment . . . |
| Keyboard adjustment is not currently
available for Session Statistics. For more information on technical
indicator adjustment, click here. |
|
User
Strategies . . . |
| |
|
|
|
| If you have a
strategy involving this indicator that you'd like to share, please
email support@linnsoft.com
|
|