Home                           

 Try Investor/RT             

 Investor/RT Tour           

 Getting Started              

 What's New                  

 Testimonials                 


MASTER INDEX
  SEARCH
  CHARTS
  MAIN TOOLBAR
  SETTING PREFERENCES
  TECHNICAL INDICATORS
 
WHAT'S NEW
  ALARMS
  BACKTESTING

  CONFIRMING TRADES
  CUSTOM COLUMNS
  CUSTOM INDICATORS
  CUSTOM INSTRUMENTS
  CUSTOM PRICES
  DATA FEEDS
  DATABASE
  DOWNLOADING DATA
  FEED STATUS
  HEARTBEAT
  HELP
  MULTI-LINKING
  MULTI-PERIODICITY
 
INSTRUMENT SETUP
 
NASDAQ LEVEL II
 
NEWS TICKER
 
NEWS BROWSER
  OPTIMIZATION
  OPTIONS ANALYTICS

  PLACING TRADES
  PORTFOLIOS
  PRESETS
 
PRINTING
  QUICK QUOTES
  QUOTE PAGES
  REALIZATION
  RTL LANGUAGE
  SCANS
  SCHEDULES

  SCOPE
  SYSTEM STATUS
  TICKER TAPE
  TIME AND SALES

 
TRADING NOTES
  USER VARIABLES
  VERTICAL SCALE
MASTER INDEX
DICTIONARY
FEEDBACK

Investor/RT Tour ( more on Technical Indicators )
Statistics Indicator
The Formula . . . 

. . .more on Formulas 

NA
 
The Presentation . . . 

. . . more on Charts 

Statistics

Above is a Daily Chart of Intel (INTC).  The Statistics indicator is added twice, once to depict the Highest High For Preceding 8 Periods (in green), and once to depict the Lowest Low For Preceding 8 Periods (in red).  The latter is drawn using the preferences specified below.

 
The Preferences . . . 

. . . more on Preferences 

  • Calculate - This dictates the statistical operator to use, and the price on which to use it.  The statistical operators are Minimum, Maximum, Total, Average, Standard Deviation, Skew, Kurtosis, Higher, or Lower.  The price options are Last, Open, Close, High, Low, Hi+Lo/2, Hi+Lo+Cl/3, OHLC/4, % Change, Bid, Ask, Volume, Open Interest, Hi-Lo Range, Op-Cl Range, Op+CL/2, and H+L+C+C/2.

  • For Preceding __ Periods  - This option will compute the statistical operation over a specific number of bars, based on the period specified.

  • Since - This option will compute the statistical operation over a period since a specific date and time.

  • Resulting Value - There are two options for the resulting value.  The most common option the "Actual Value" option.  This gives the actual value that resulted from the operation (Maximum High, Standard Deviation of Close, etc.).  The other option is "Bars Since Value".  This option may be used in conjunction with "Higher High" or "Maximum High" for instance.  If you chose "Maximum High", and specified "Bars since Maximum Value" as your resulting value, then the result would be the number of bars since the maximum value over that period.  On the other hand, if you chose "Higher High", and specified "Bars Since Higher Value", then the result would the the number of bars since the price reached a higher high.

  • Draw as... - There are four options for drawing the resulting indicator:  Continuous Line, Connected Line, Solid Histogram, and Hollow Histogram.

  • Line Color - Color, style, and thickness of the resulting indicator line.

 
The Description . . .

The statistical indicator is a very flexible indicator that allows you to compute any of the statistical measures or operators listed below, on any of the available prices listed below, for a total of 144 possible combinations.

Statistical Operators

Price Options

Minimum 
Maximum 
Total 
Average 
Standard Deviation
Skew
Kurtosis
Higher
Lower

Last
Open
Close
High
Low
Hi + Lo /2
HLC / 3
OHLC / 4
% Change
Bid
Ask
Volume
Open Interest
Hi-Lo Range
Op-Cl Range
Stop


1. Minimum - Lower price value over the period specified.
2. Maximum - Highest price value over the period specified.
3. Total - Summation of price values over the period specified.
4. Average - Average of price values over the period specified.
5. Standard Deviation - Standard Deviation of price values over the period specified.
6. Skew - Skew of price values over the period specified.
7. Kurtosis - Kurtosis of price values over the period specified.
8. Higher - Higher value than current price values.  This operator does not use the period, and is usually used in the context of "Bars since higher price".
9. Lower - Lower value than current price values.  This operator does not use the period, and is usually used in the context of "Bars since lower price".

Some common example combinations would be as follows:

To find the smallest range over the past 10 bars:
Minimum Hi-Lo Range for preceding 10 periods

To find the 30-period Standard Deviation:
Standard Deviation of Close for preceding 30 periods

To find the highest high of the last 55 bars:
Maximum High of preceding 55 bars.

To find the lowest low of the last 20 bars:
Lowest Low of preceding 20 bars.

To find the number of bars since a lower low was reached.
Lower Low (with Resulting Value "Bars Since Lower Low")

To find the average open-close range over last 13 bars:
Average Op-Cl Range for preceding 13 bars.

As you can see, the Statistics indicator is very flexible and gives the user the ability to do many things.  And the results can be seen in a chart, or can be used in RTL for scanning, backtesting, or custom indicators.

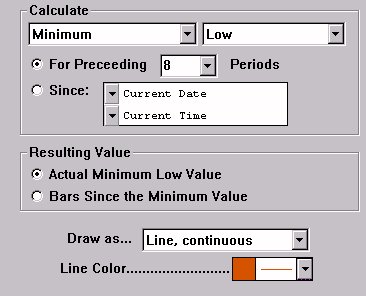
The user specifies the period to use in calculating the statistical values.  The period can be either a specific number of bars, or a period since a specific fixed starting date/time.

There are two options for the resulting value.  The most common option the "Actual Value" option.  This gives the actual value that resulted from the operation (Maximum High, Standard Deviation of Close, etc.).  The other option is "Bars Since Value".  This option may be used in conjunction with "Higher High" or "Maximum High" for instance.  If you chose "Maximum High", and specified "Bars since Maximum Value" as your resulting value, then the result would be the number of bars since the maximum value over that period.  On the other hand, if you chose "Higher High", and specified "Bars Since Higher Value", then the result would be the number of bars since the price reached a higher high.
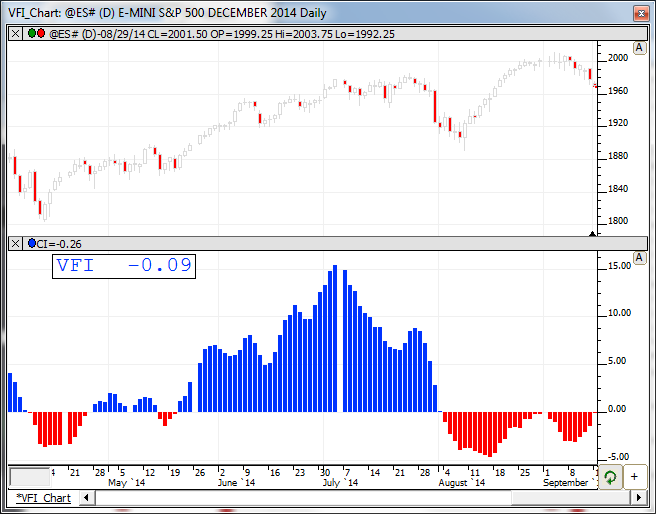
RTL Token . . . STAT ( more )

That RTL token for the statistics indicator is STAT.  For example, you could configure STAT to be the maximum closing price for the past 30 periods and use a scan request of (STAT - CL)/CL > .15 to find all issues that are at least 15% below their 30 day high.

You could configure STAT to be the standard deviation of median price during the preceding 100 periods and scan all issues with the scan request STAT != 0 and specify that the result be sorted in descending sequence by STAT. This will rank all issues by their calculated 100 day standard deviation.
  

Keyboard Adjustment . . . (version 5.5 and forward)
The period of the Statistics indicator can be adjusted directly from the keyboard without having to use the preferences window.  Simply select the Statistics indicator and then hit the up arrow on your keyboard to increase the period by 1, or hit the down arrow on your keyboard to decrease the period by 1.  The Statistics indicator will adjust dynamically to represent the new period.  For more information on technical indicator adjustment, click here.
 
Q & A . . . 
How do I reference the historical 52 week high (or low) for a daily chart or backtest?  Answer
 
User Strategies . . . 
 
      03/07/02
   
Coming Soon . . .

If you have a User Strategy you'd like to share, please email support@linnsoft.com