The Trendline Indicator is a tool for drawing lines from a starting price and time to another price and time in the chart. To draw a trend line, activate trend line drawing by depressing the Trend Line Button  in the chart toolbar. The "button" will remain visually depressed to denote that trend line drawing mode has been selected. The cursor changes to a pencil. Position the mouse and press down to start the trend line. Drag to position the trend line and release the mouse to add the trend line to the chart. To disable trend line drawing, click the trend line tool icon. The cursor will return to the standard arrow.
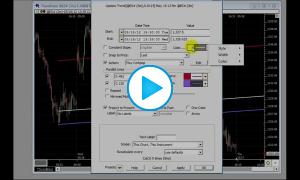
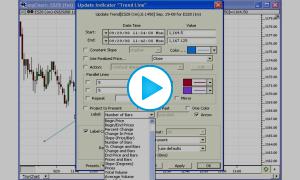
Multiple parallel lines may be drawn both above and below the base trendline. The parallel line text boxes accept multiple percent values if desired, separated by a space of a comma (eg. "3.2, 4.5, 7.1"). The distance of each parallel line from the base trendline is determined using a percent level. The percent level represents a percentage of the price where the base trendline begins. For instance, a parallel line drawn 1% above a trendline that has a beginning point of $50 would be drawn exactly 50 cents above the base trendline at all points. The parallel lines may also be repeated any number of times. In the example above, repeating the parallel line 4 times would result in additional lines $1.00(2%), $1.50(3%), $2.00(4%), and $2.50(5%) above our base trendline, for a total of 5 parallel lines above. These parallel lines may also be mirrored on the opposite site of the trendline. Using the example above, parallel lines would also be drawn at 1%, 2%, 3%, 4%, and 5% below our base trendlines. The trendline furthest below would begin at $47.50 and remain $2.50(5%) below the base trendline at all points. If you prefer to see parallel lines on your trendlines by default, you may do so by adjusting an existing trendline to display the desired parallel lines (repeating, mirrored, etc.), and then click the "Make Default" button at the bottom of the trendline preferences window. The base trendline, parallel lines above, and parallel lines below, each have their own color preferences. The one color checkbox forces all lines to use the trendline color.
Attempting to draw a trend line in a chart sub window that contains only technical indicators results in an error message. If you have a chart containing two or more instruments, as long as each instrument resides in its own sub-window, you may draw as many trend lines as you like on each instrument. If you have two or more instruments in the SAME sub window, any trend lines drawn in the sub window will be associated with the first instrument in the sub window. Trend Lines can be adjusted using the mouse. Mouse down at one end of the trendline and drag. Trend Lines are anchored at one end as you move the other end of the trend line to its new position. You can duplicate a trend line by dragging with the Ctrl (option on Macintosh) key down. The original line remains the same as before the drag.
The Trendline tool may also be used as a general purpose chart markup tool, drawing arrow headed lines in the chart to call attention to a particular place in the chart. This is done by turning off the Project to Present checkbox and checking the Arrow check box in the default preferences you use for trendline drawing. Each trendlilne drawn thereafter will then terminate with an arrowhead.
Presentation

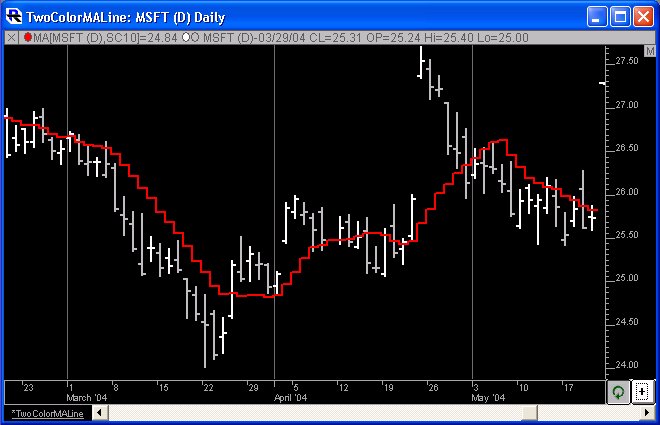
Above is a Daily Chart of an AOL May 70 Call (AOO EN). The bold green line in the lower window pane represents the TD REI line, as specified in the preferences below.
Keyboard Adjustment
The keyboard can be used to move the Trendline end-points to the right and left, or up and down. First, click on the chart. Then hit the tab key repeatedly until you notice your Fibonacci Retracement lines are selected. Then, press the right or left arrow keys on your keyboard to move the entire trendline (along with any associated parallel lines) right or left one bar. To move the trendline up or down, press the up and down arrows on the keyboard. If you would like to move only the endpoint, then hold down the Ctrl key while pressing the right or left arrow keys. If you would like to move only the beginning point, then hold down the Shift key while pressing the right or left arrow keys.