The Vertical Reference Line is a drawing tool that can be used to draw labelled lines at any data/time in the chart. To access the tool
- Click on the "Vertical Line" tool on the chart toolbar or
- Right Click on the chart and select the Vertical Line option in the "Draw" menu that offers an easy access to all manual Drawing Tools
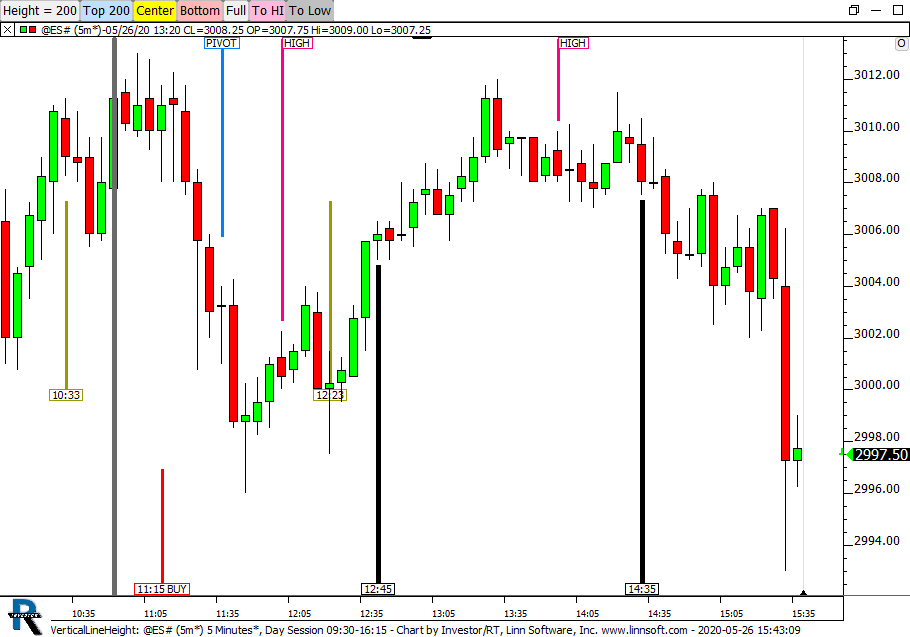
Then position the mouse pointer at any time point in the chart window and click. While the vertical line tool is active, the cursor changes to a pencil. Click as many times as you like to add as many vertical reference lines as you wish. To turn off the vertical line tool, click on the "Vertical Line" tool on the chart toolbar again. Once you have positioned a vertical line you can "edit" the properties of the vertical line to change its position or to record an associated comment, or change the line color and thickness to your preference. To edit a vertical reference line right click in the chart window and choose the "VREF" chart element. The comment associated with a vertical reference line is only shown in the chart window when the vertical reference line is "selected".
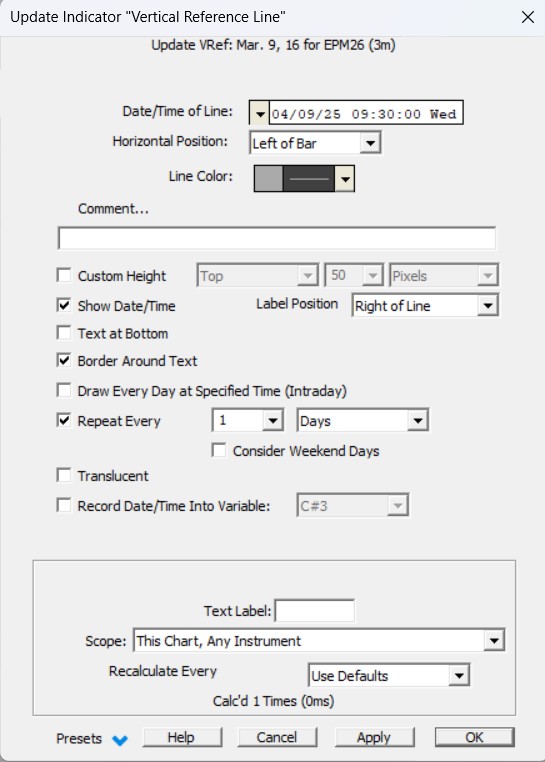
To select the vertical reference line either click on it or press tab repeatedly until the line is selected (or select it in the Chart Element Manager). Vertical reference lines are saved permanently with the chart and will reappear when the chart is opened again later. You can also add vertical reference lines using the "Add a Technical Indicator" button on the chart toolbar. When the Add Indicator window appears, pick Vertical Reference Line, enter the settings for the desired vertical line, including the date (and optionally the time) position of the line, and click OK to add the indicator to the current chart window.
Alternative to the Vertical Lines
- The Annotation Indicator is another tool you can use to record comments that are stored and associated with a particular date and time in a chart window.
- The Paint Indicator, with the Paint Background Option, allow you to automate the drawing of vertical lines, upon specific Signal or Custom Indicator values
Presentation