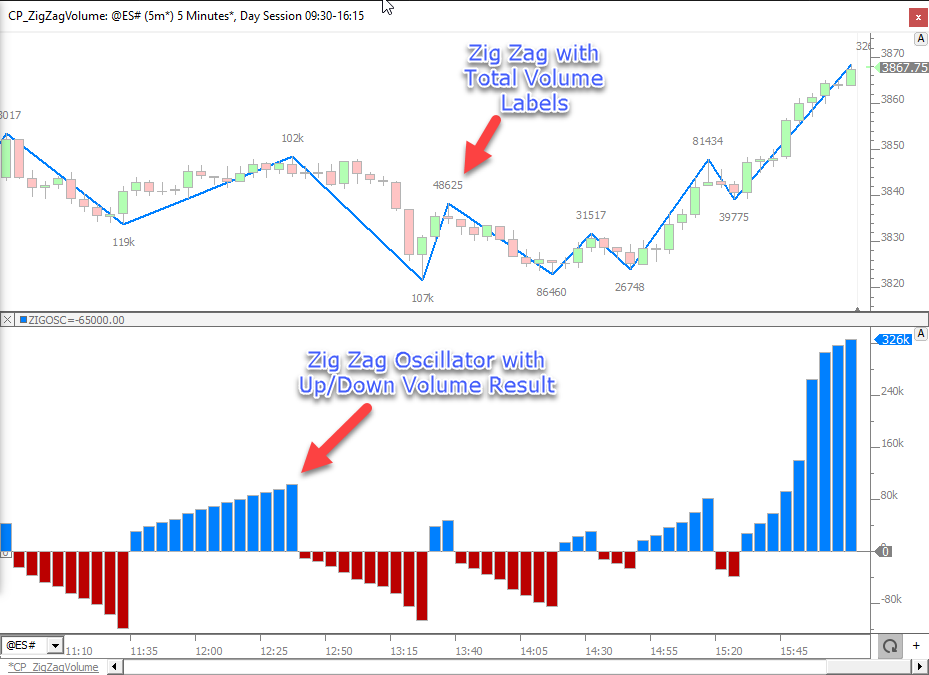
The Zig Zag Oscillator indicator provides a way of viewing the Zig Zag Indicator information in a different form. Through the years, the Zigzag oscillator has become one of the most versatile indicators of the whole Investor/RT unique toolkit when it comes to analyse waves and identify market conditions.
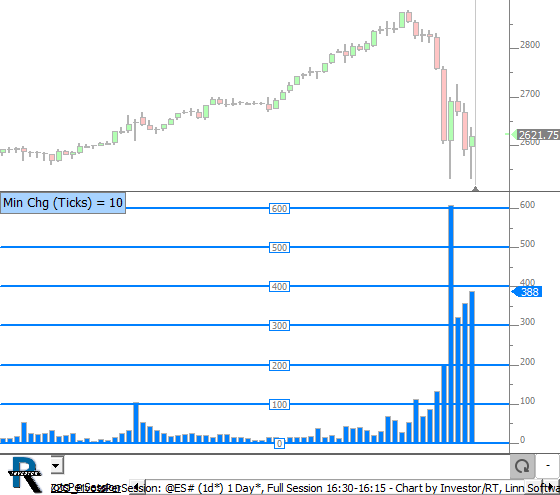
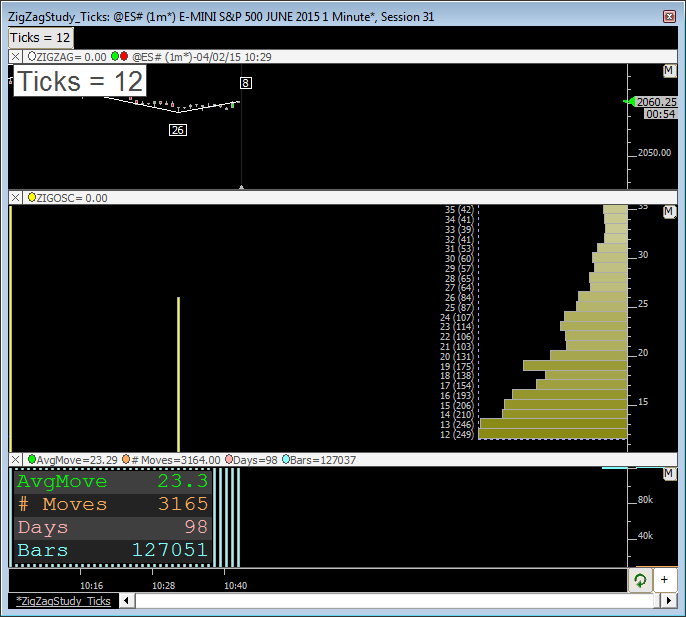
The very first output result of the ZZO indicator represented the percent change at each bar of the current price from the base price of the current ZigZag leg. When the ZigZag is currently in an uptrend state, the Zig Zag Oscillator will be above 0. Similarly, when the Zig Zag is in a downtrend state, the oscillator will be below 0. Optionally, reference lines may be drawn at any percent change level. If a reference line value of 10% is specified, reference lines will be drawn at both 10% and -10%. It is common to draw the reference lines at the same level as the minimum percent change level, to see clearly when prices have reached the minimum required level.
Since this first output, more than 40+ other results (detailed in the preference tabs) have been added to provide access to various data elements characterising the components of a zigzag line, ie the pivot, directions, rotations, etc . Many of these options, such as the Flex statistics one, were created upon customer requests, as these traders needed to access easily aggregated information about the different current and past zigzag waves. Their goal was to identify market congestion and trending periods, and create filters that will improve the profitability of their favourite trading signals. In one sentence, identify long lasting edge for their trading strategies by incorporating such market condition filters into their trade entries and exits setups.
Indeed, the Zigzag oscillator output results are mainly used through the corresponding ZZO tokens incorporated into the RTL formula used to build Custom indicators and Signals markers.
When added directly into a chart, the ZZO outputs returning price information (see the list in the preference Tabs) can be directly displayed on the main instrument pane, typically using a "line" or "steps" style. In contrast, all other ZZO outputs displayed on charts are typically added as a histogram to a separate pane. Very often, custom indicators will also be added to the chart, but with the "invisible" style, with the corresponding values being displayed at pivot bars thanks to the dedicated zigzag line "custom indicator" label features.
Presentation
Important notice :
The Zig Zag Oscillator is unique in that it is a forward looking indicator, and as such, past values can change based on future price movement. More specifically, whatever the retracement criteria method (%, $, ticks, bars, fractals), a pivot bar will only become “confirmed” after a certain number of bars (ie whenever the retracement criteria is completed)
Please review this video that demonstrates how to manage the usage of the forward-looking Zig Zag Oscillator within a Custom Indicator or Signal Marker.Due to this forward-looking nature, when the ZZO token is used within RTL, special consideration must be made to accommodate the addition of any Custom Indicators or Signals that contain ZZO when adding to a chart.
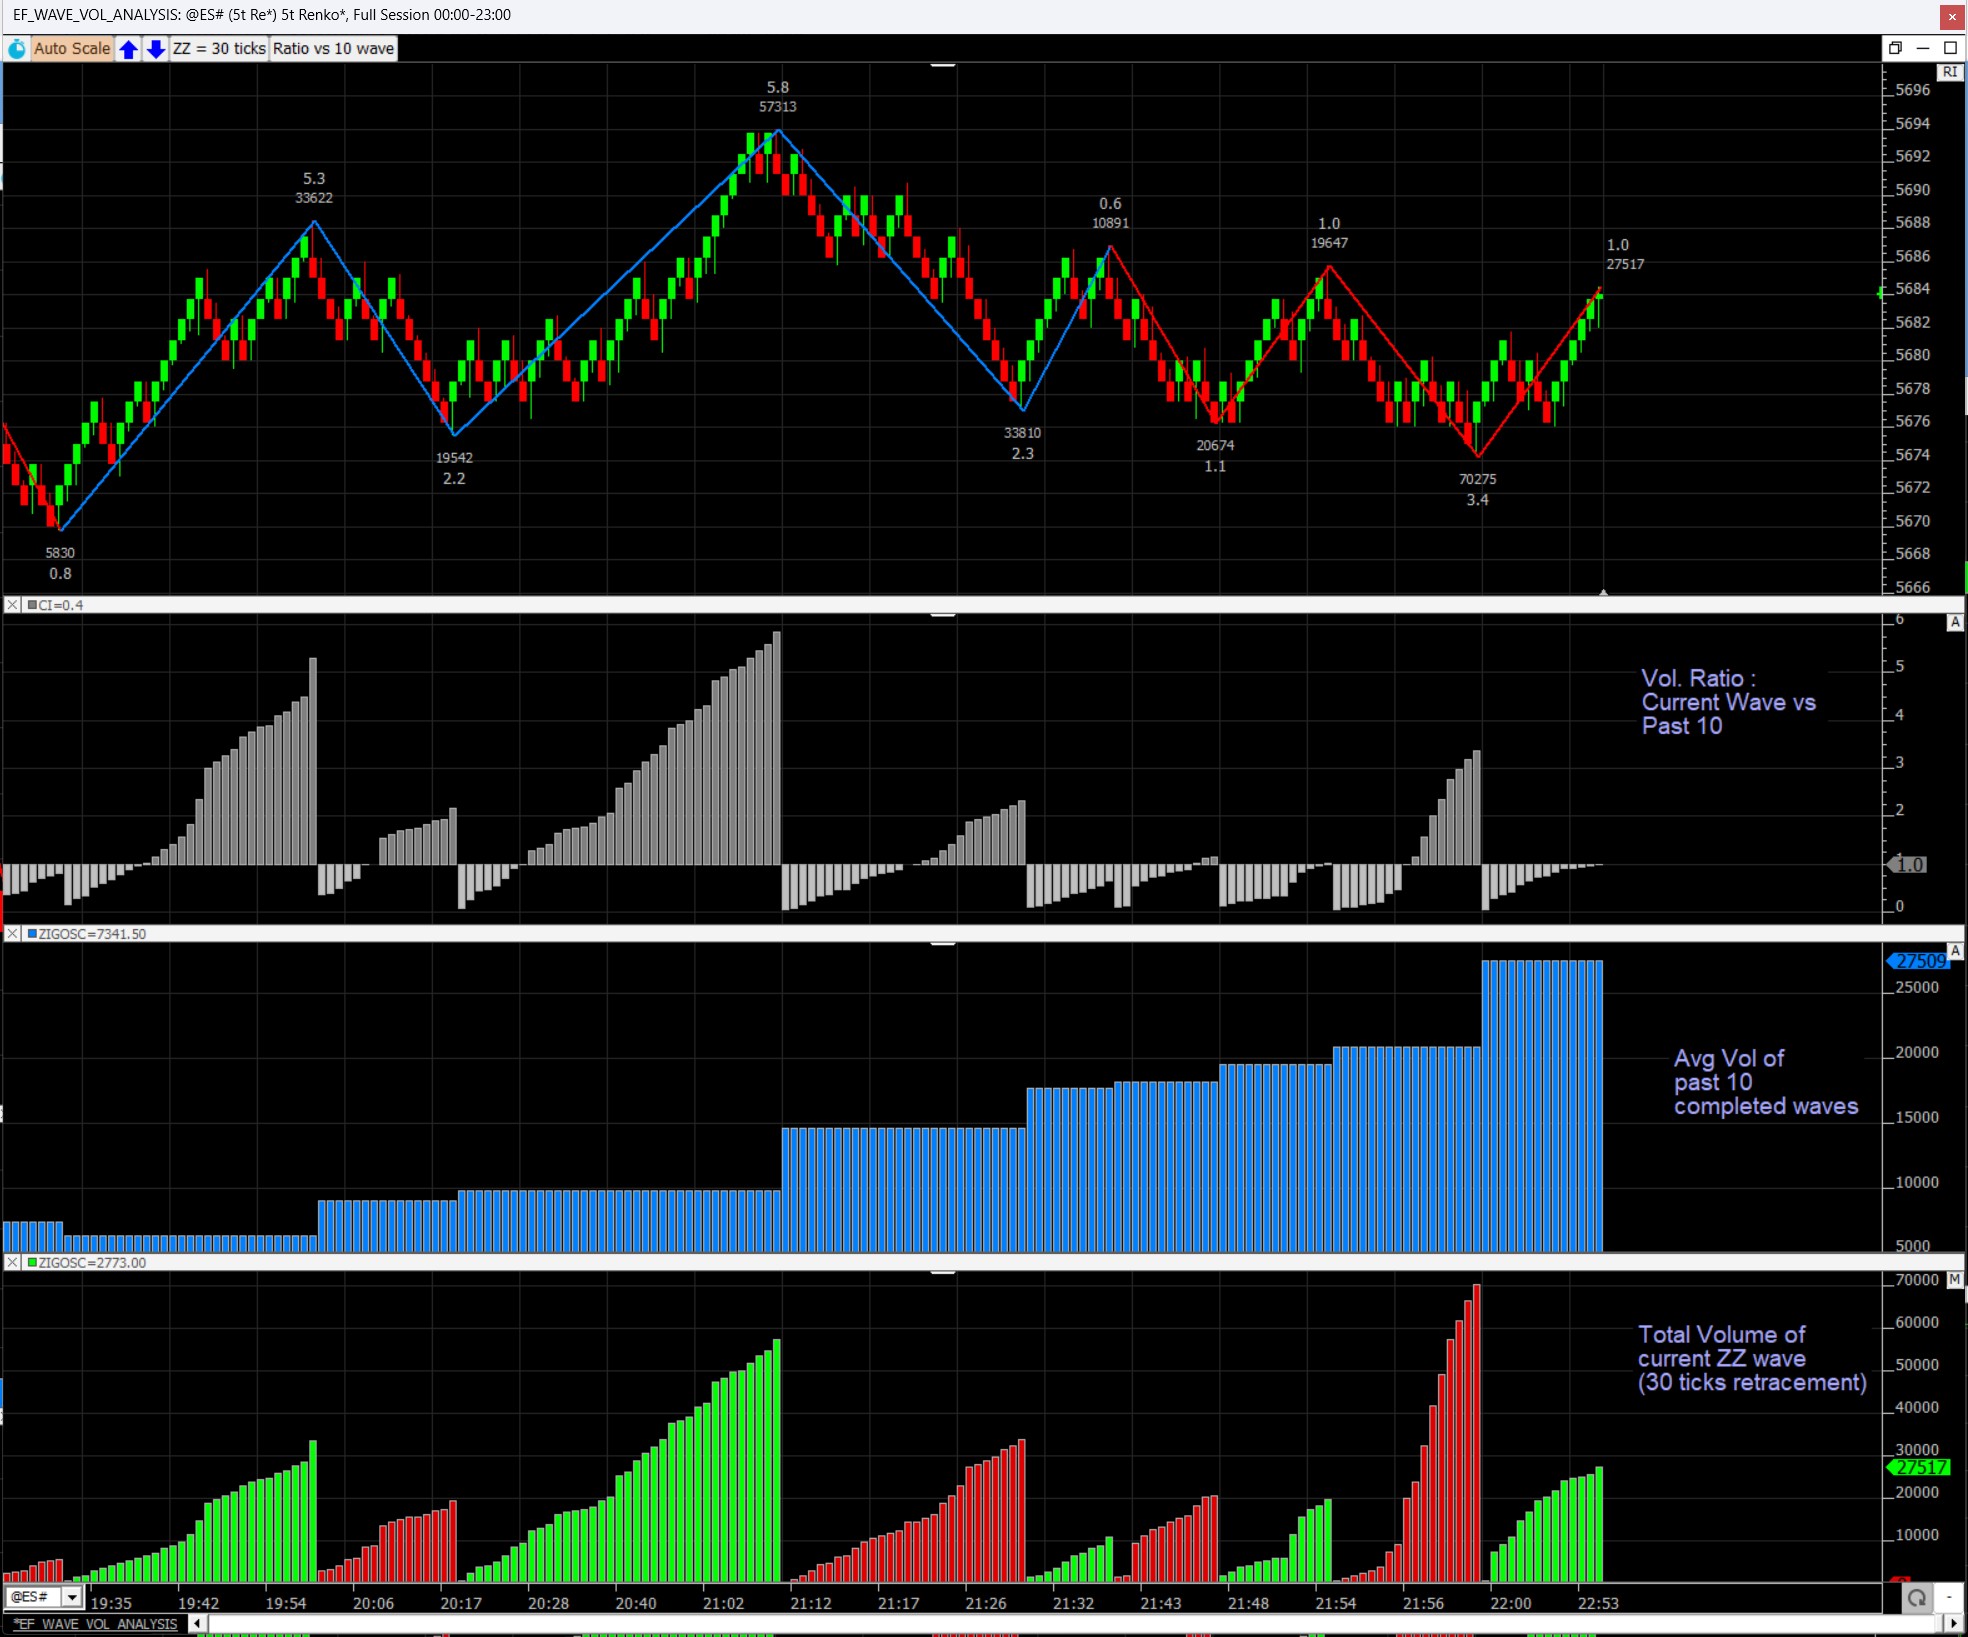
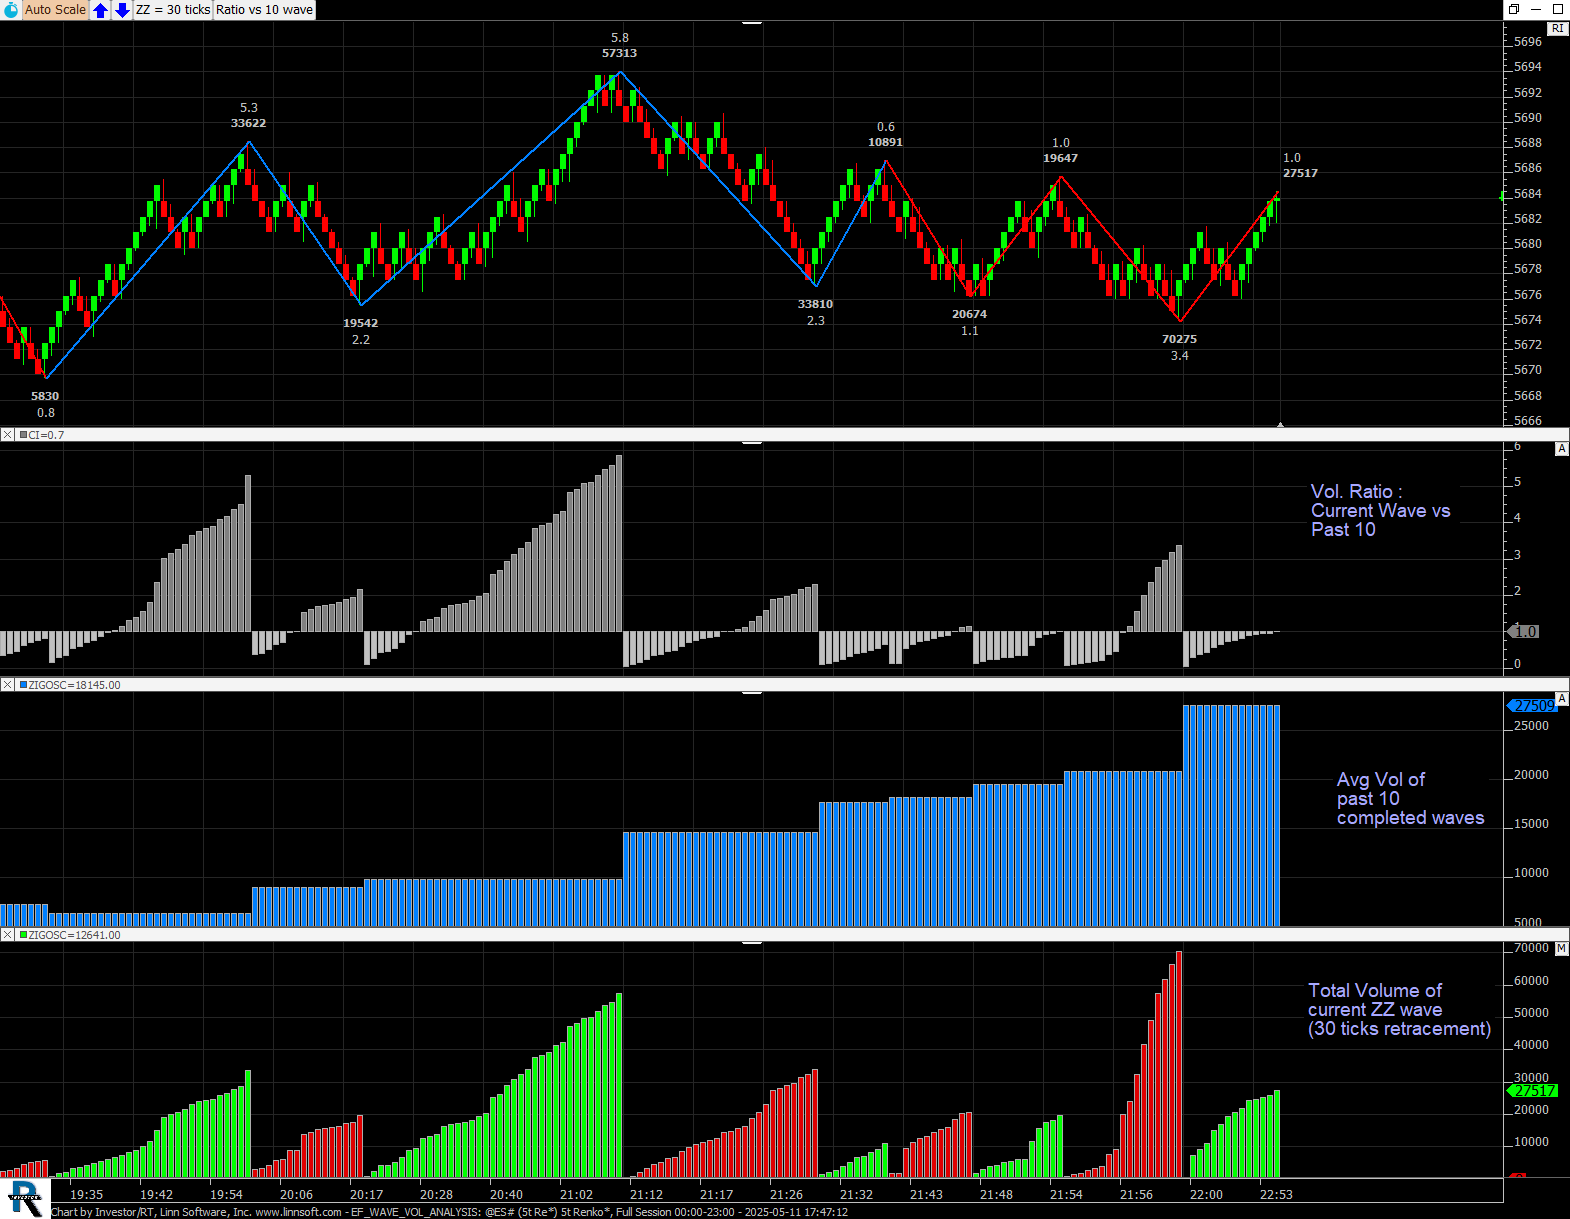
Above screenshot is a 5 tick Renko chart of the S&P 500 E-mini, with two ZZO output results used to calculate the ratio of the current wave volume vs the previous 10 waves. See more details in the examples Tab.
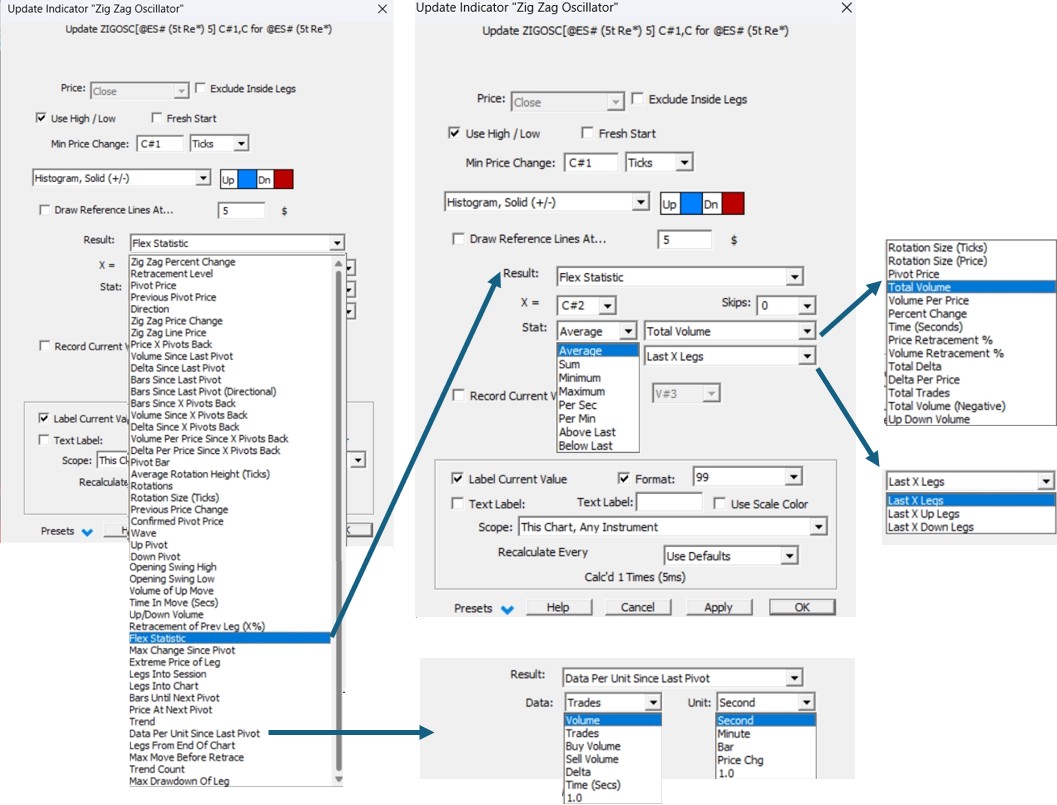
Below is an expanded view of all the main possible outputs (detailed in the Preferences Tab) that can be accessed through the ZZO indicator, with a focus on the "flex statistics" and "Data per unit since Last pivot" options. Associated with other Investor/RT unique features, such as the Signal and Session statistics indicators and the Multi periodicity features (through the MPD indicator), the ZZO indicator is ultimate wave analysis tool (that requires zero additional coding) as all corresponding outputs can be accessed in the RTL language through the ZZO token.