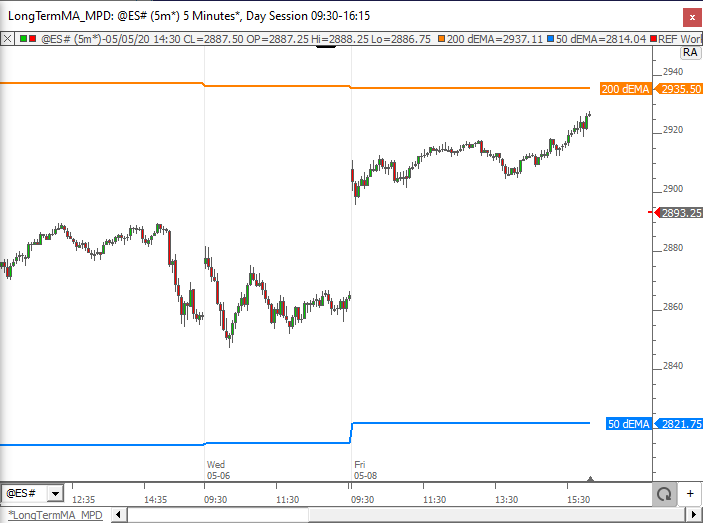
The Mixed Periodicity Data Indicator (MPD) gives the user access to different periodicities of data than the periodicity of the underlying instrument or scan. The MPD preferences ask for both a periodicity and the data (price) from that periodicity that will be displayed. MPD essentially loads data of another periodicity, the right-aligns it to the data of the underlying instrument or scan. The MPD data will not generally reflect the date/times show in the horizontal scale along the bottom of the chart. MPD should be consider on it's own scale. You can point at any MPD element to get the date/time of that element in the pane title feedback. There are quite a few ways that this indicator may be used. The best way to describe MPD may be to give you a few examples of how it might be used.
Presentation

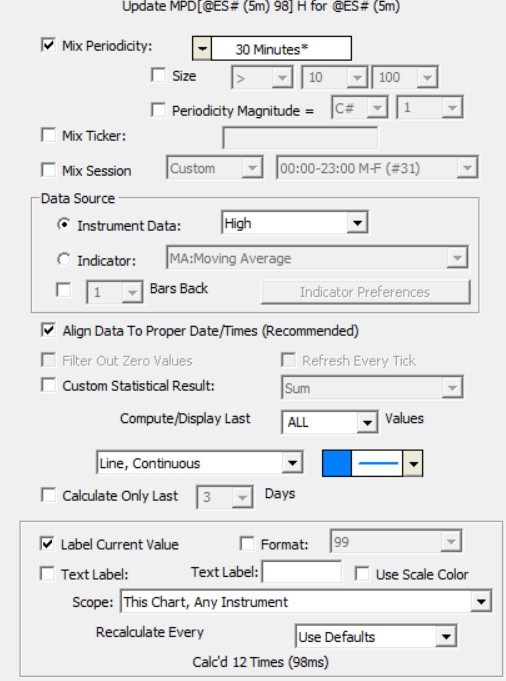
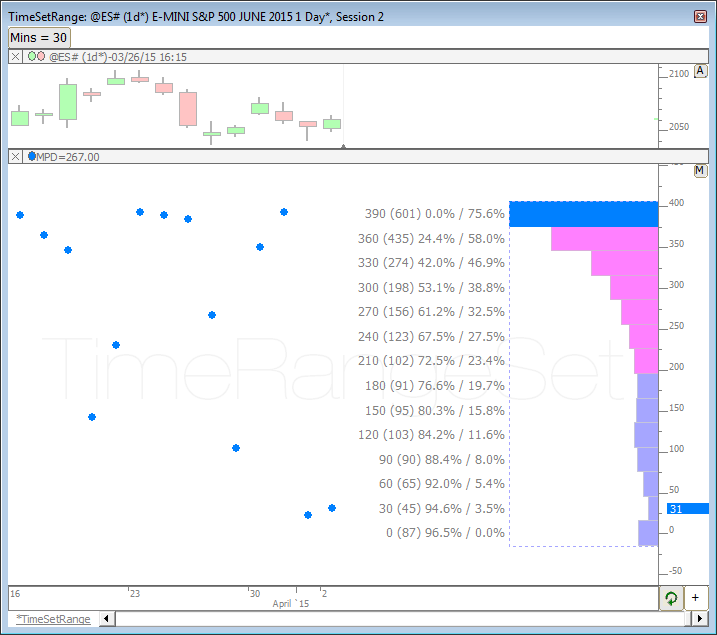
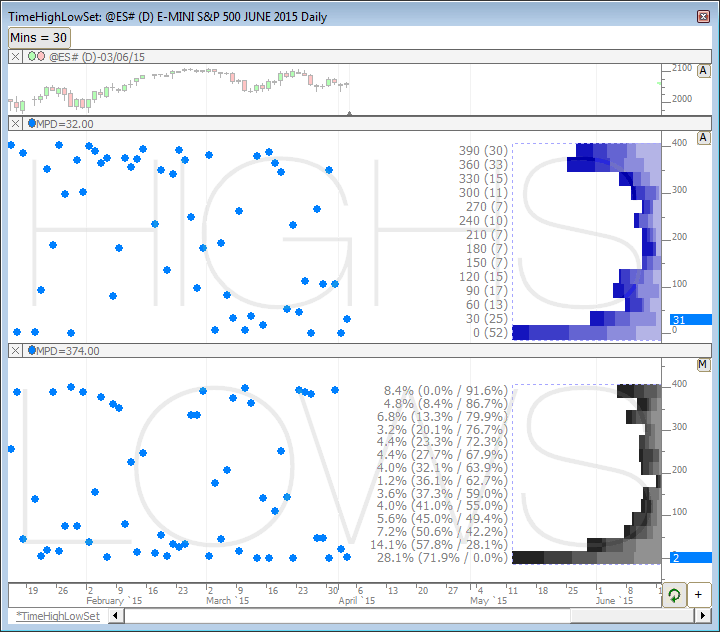
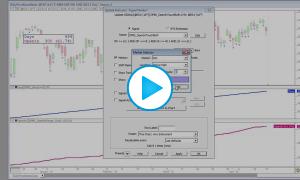
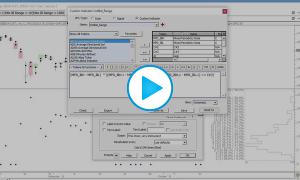
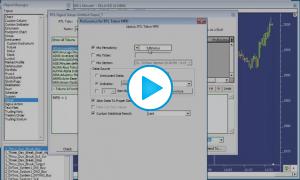
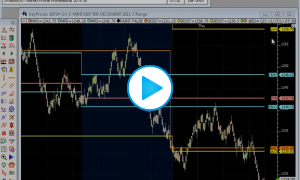
Above is a 5-minute Candlestick Chart of an Microsoft Corporation (MSFT). The Mixed Periodicity Data (MPD) indicator is drawn three times in the chart. Two MPD's in the upper pane access the previous daily high and low values, and stretch them across all the 5-minute bars of the following day. The lower pane contains an MPD which represents the number of ticks in each 5-minute bar, using MPD preferences similar to those seen in the preference window below.

Keyboard Adjustment
Keyboard Adjustment The lookback period (load last X bars) of the MPD indicator can be adjusted directly from the keyboard without having to use the preferences window. Simply select the indicator and then hit the up arrow on your keyboard to increase the period by 1, or hit the down arrow on your keyboard to decrease the period by 1.