The Three Line Break Oscillator (TLBOSC) was designed to give Three Line Break users an indicator on traditional charts that clearly shows all relevant TLB information (reversal price, current price, extreme price, etc.) in a flexible and vertically condensed fashion. The indicator oscillates about the zero line. Crossing above the zero line represents a positive TLB reversal (buy signal), and crossing below the zero line represents a negative reversal.
TLBOSC however shows much more than just reversals. It shows the current price (a small dot), the relative reversal price (in histogram form), and the lines formed in either direction. The most important aspect of the indicator at any time is the distance from the the current price to the reversal price (should we anticipate a reversal soon?). Arrow markers are draw below the upward reversal bars and above the downward reversal bars.
In addition, the TLBOSC has a powerful "Custom Value" option that provides the flexibility to show any of the following TLB data elements. These custom values can be charted individually, in line or histogram format. These values can also be reference in the RTL language for scans, custom indicators, and trading signals. The token is TLBOSC. The resulting value of the TLBOSC token will simply be the corresponding Custom Value that is selected within the preferences.
Custom Result Description State - Represents the number of lines which have been formed in the current direction, since the last reversal. This value oscillates about zero and clearly shows reversals. Current - Reversal Price - The difference between the current price, and the price needed to create a reversal. This value oscillates about zero and clearly shows reversals. The closer the value is to zero, the closer it is to a reversal. Reversal Price - The price currently needed in order to create a reversal. High of Line - High price of the current line. Low of Line - Low price of the current line. Line Height (Hi - Lo) - Height of the current line (High of Line minus Low of Line) Direction (1 = Up, -1 = Dn) - Current direction of the Three Line Break chart. A value of 1 represents rising, while a value of -1 represents a falling state. Bars in Direction - Number of bars spent in the current direction. This value gives an indication of how long it's been since the last reversal. Extreme Price - The extreme price is the price that must be exceeded in order to create a new line in the current direction. When the TLB is rising, the extreme price will be the high of the current line. When the TLB is falling, the extreme price will be the low of the current line.
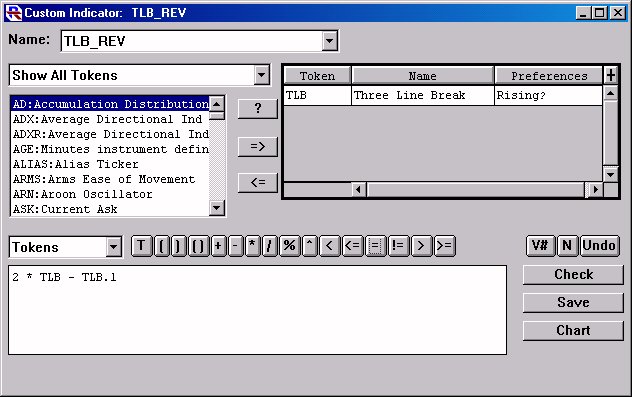
The Three Line Break Oscillator can be referenced in RTL using the token: TLBO. This token gives the user access to any of the custom results available in the TLB Oscillator, including State, Current - Reversal Price, Reversal Price, High of Line, Low of Line, Line Height (Hi - Lo), Direction (1 = Up, -1 = Dn), Bars in Direction, and Extreme Price. To find an instrument that has just reversed up, the "Direction" result would be used (TLBO > TLBO.1). To find an instrument that has formed at least 5 lines in the upward direction, the "Bars in Direction" result would be used (TLBO >= 5). To find an instrument that may be nearing it's upward reversal, the "Current - Reversal Price" result would be used (TLBO > TLBO.1 AND TLBO/CL < 0.02).
Presentation

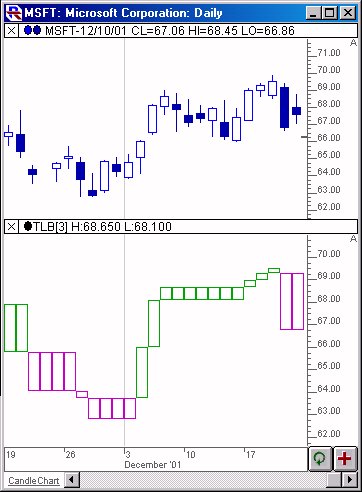
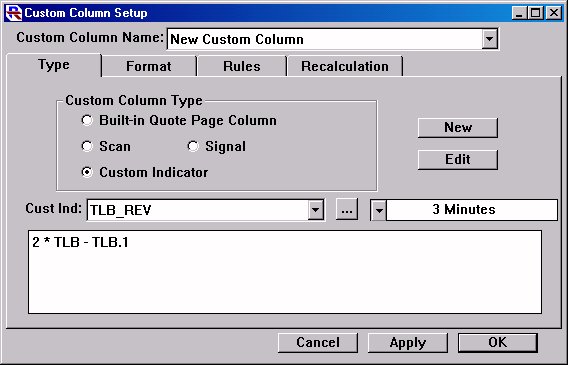
Above is a 3-minute Candlestick Chart of Intel (INTC). The lower pane shows the TLB Oscillator drawn using the preference seen below. The red dots represent the relative current price. The green histogram represents the relative reversal price. The dark and light gray squares represent the "lines".