Profile Indicator (PROF)

Profile Indicator requires the Profile Package.

The Profile indicator enables the user to overlay a price-based profile over a multi-pane intraday chart. The Profile provides a "Price/Row" preference which dictates the height of each row. The width of each resulting row will represent how many bars during the session in which that row's price range was touched. If the periodicity of the chart is 5-minute, and the width of a row is 3 bars wide, then the range of three of the 5-minute bars for that session actually overlapped the price range of that row. The widest row is called the Point of Control (POC). The Value Area (VA) is commonly considered the area in which 70% of the price action transpired. This percent level is adjustable, as some prefer to use alternate VA % levels such as 80%. Options for drawing the current and previous POC and VA lines are provided in the Profile preferences. Another option dictates how many sessions for which the Profile will be computed and displayed. The Profile may be drawn as Solid or Hollow Blocks, Solid or Hollow Ovals, Dots, or Lines. A "Hide Profile" checkbox gives the user the ability to hide the actual profile and draw only current and/or previous POD and VA lines. The "Current" and "Previous" POC and VA lines are also optional, as well as VA and POC labeling.

Presentation

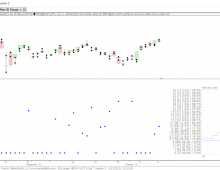
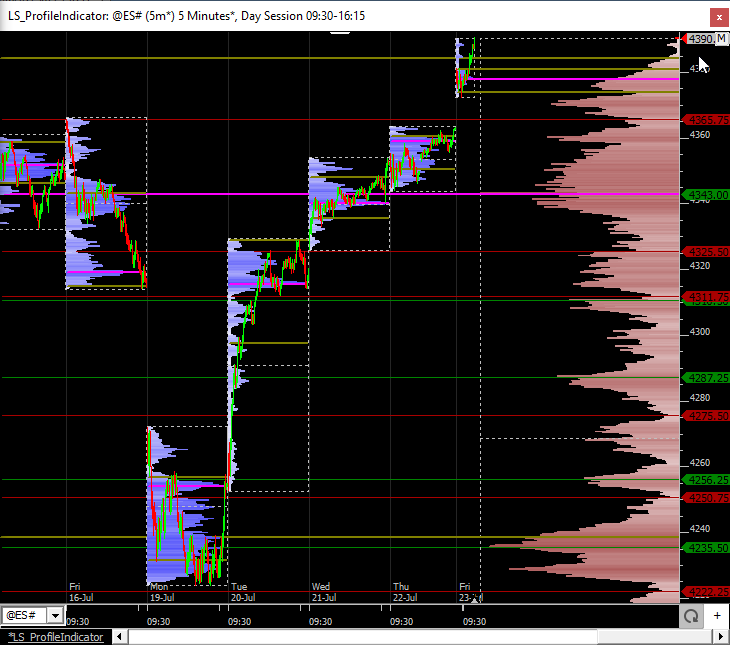
 Above is a 5 Minute chart of ES with 2 instance of the Profile Indicator.  The blue profile is a daily volume profile and the red profile on the right is a cumulative volume profile with high volume nodes (green) and low volume nodes (red).

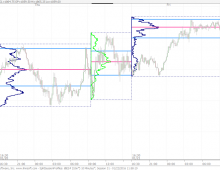
Above is a Daily chart of the S&P mini contract (@ES#) showing monthly, year, and multi-year (10 year) profiles.

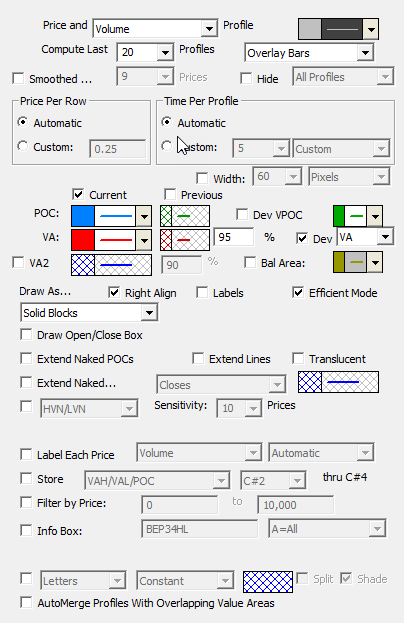
  • Price and Time/Volume -This option controls whether "time" or "volume" is used when computing the profile(s). If "time" is used, the width of each row in the profile represents the number of bars (over profile period/width) which hit the price range of that row. If "volume" is used, the width of each row represents the volume traded in that rows price range.

  • Hide Profile -If this checkbox is checked, the actual profile itself will not be drawn, allowing the user to draw the VA and POC lines alone.

  • Compute Last ___ Profiles -This option controls how many profiles (sessions) are computed and drawn in the chart. The color control to the right controls the color of the rows outside the value area.

  • Price/Row (Height) -This option controls the "height" of each row of the profile, or the range of prices which each row represents. If a value of 0.04 is specified, for instance, then potential rows would include 0.00 to 0.04, 0.04 to 0.08, ..., 25.08 to 25.12, ..., 100.40 to 100.44, etc. If "Automatic" is selected, Investor/RT will use a reasonable height based on the trading range of the instrument and the timeframe involved.

  • Price/Row (Height) -This option controls the period of time which each profile covers. The "Automatic" option is chosen, a period of "last 100 days" will be used for daily, weekly, and monthly periodicities, while a period of "every 1 day" will be used for intraday periodicities.

  • Current -This checkbox controls whether the current VA and POC lines will be drawn.

  • Previous -This checkbox controls whether the previous VA and POC lines will be drawn.

  • Value Area -This controls the color, style, and width of the current and previous value area lines. The value to the right dictates the % level of the Value Area. The most common value area setting is 70%.

  • Point of Control -This controls the color, style, and width of the current and previous point of control (POC) lines.

  • Dev VPOC/VA/Balance Area/MVP - When these checkboxes are checked, the developing price, such as VPOC is plotted so that the user may see where that price was as of each bar as the profile was "developing".  Options to plot the developing VPOC VA,, Balance Area, and MVP.  The MVP stands for Mid Volume Price and is the price at which there is an equal amount of volume both above that price and below that price.  Balance Area is computed by taking the max of the distance from the VPOC to the high and the VPOC to the low, and adding and subtracting that value from the VPOC to get the Balance Area High and Low.

  • Std Dev Based VA -If this checkbox is checked, the POC will represent the volume/time-based average price, while the VA will be computed using a 70% standard deviation band based off of the average price POC.

  • Label VA and POC -This checkbox controls whether the prices of the VA and POC lines will be labeled.

  • Draw As -This controls the drawing style used to draw the profiles. Choices include "Solid Boxes", "Hollow Boxes", "Solid Ovals", "Hollow Ovals", "Dots", and "Lines". When the PROF token is used in a scan, this control will change to one labeled "Result:" with options of "Upper VA (Curr)", "Upper VA (Prev)", "Lower VA (Curr)", "Lower VA (Prev)", "POC (Curr)", and "POC (Prev)".

  • InfoBox -If checked, displays an Info Box containing statistics on each profile. This can also be toggled on/off using the +/- icons on each Profile. For users that do not want to see the +/- icons, go to Setup > Configuration and set the Configuration Variable ProfInfoBoxButton to False.
Labeling Options

  • Volume: Amount of Volume at each price.
  • Volume(Bars): Amount of Volume at each price with the number of bars that touched that price in parenthesis.
  • Bars: Number of bars that touched that price.
  • Rank: The ranking of each prices volume relative to those within its sensitivity area. For instance, if the sensitivity is 10, the rank of each price will range from 1 (highest volume) to 21, as it's including each price, and the 10 prices above and 10 prices below it. The Rank statistic is also exportable when right-clicking on Profile Indicator and "Export Data".
  • Volume (Rank): Amount of Volume at each price with the Rank (as explained above) in parenthesis.
  • Volume >rvRatio: Short for Relative Volume Ratio. This is a ratio of the volume at each price and the volume of the price inside of it (towards the VPOC). This ratio shows how aggressive participation was by comparing the volume of the current price to the prior price. Under normal circumstances, the ratio should drop significantly as prices are perceived to be unfair.
  • Price (Bars): Price level with number of bars that touched that price in parenthesis

Keyboard Adjustments

Keystroke Resulting Action Notes
Up Arrow Scroll Chart Up One Row Only has effect when chart is too big vertically for visible window.  Mouse wheel also scrolls.  Can also drag chart left or right to scroll or pan.  Vertical Scroll bar also available.
Down Arrow Scroll Chart Down One Row
Right Arrow Scroll Chart Right/Forward One Bar Only has effect when chart is too big horizontally for visible window.  Can also drag chart up or down to scroll or pan.  Horizontal Scroll bar also available.
Left Arrow Scroll Chart Left/Back One Bar
Shift-Right Arrow Scroll Chart Forward One Day/Profile Decreases the "X" in "Ending X Days Back" by one
Shift-Left Arrow Scroll Chart Back One Day/Profile Increases the "X" in "Ending X Days Back" by one
Shift-Up Arrow Increase Height of Rows Shift-Mouse Wheel also works
Shift-Down Arrow Decrease Height of Rows  Shift-Mouse Wheel also works
Ticker Symbol - Enter Changes to that Ticker Symbol Type in a new ticker symbol (like "MSFT") then hit Enter
Esc Close the Chart The Escape key can be used to close most all windows types
Ctrl-Enter Open Chart Preferences The Ctrl-Enter combination will open prefs on most all windows
Double-click Open Chart Preferences Double-click anywhere inside the chart window
Space Bar Refresh Data Downloads tick data in order to refresh data in chart.
Tab Key Toggles the Button Area On/Off Button pane is always visible when window first opens.
Number + Enter Changes Bar Period Type in any number, and then enter, to change the period of the bars to that number.  For instance, if you're looking at a 5-min chart, type 30-Enter to change to 30-minute.


IB Range Filtering
Companion chart to Extracting Market Behavior Lesson 4: Profile on Indicator: Filtering Results

Read more Download

Split Session Profiling Chart
This chart was created to accompany the video Split Session Profiling Using Profile Indicator

Read more Download

Pages

Pop-up Video Description View
TPO Profile - Composite Profiles

This video demonstrates how to build automated composite profiles (weekly, monthly, quarterly,...

 Watch
Profile Indicator Drawing Tool - Phase 2

This video demonstrates enhancements made to the Profile drawing tool in version 9.2.8 including...

 Watch
Profile Indicator Drawing Tool

This video demonstrates how to draw volume or time-based profiles across any group of...

 Watch
https://vimeo.com/112467995
Profile Indicator - Volume Profiling

This video focuses on the longer term Volume Profiling aspects of the Profile Indicator and...

 Watch
FT71 Composite Profile Details

This video is another follow-up to the webinar, which focuses primarily on the Composite Profile...

 Watch
How to create an infobox

This video was a response to a few user requests. First off, the video covers in depth how to...

 Watch
What's New in 10.5 wth Fari Hamzei
What's New in 10.5 with Fari Hamzei

This webinar covers many topics including Multiple Price Highlighter, Smoothed Profiles,...

 Watch
Profiles in 10.5
Profiles in 10.5

Profile Indicator Enhancements in 10.5 including: Peaks and Valley colors, width of time-based...

 Watch
Profile Indicator
Profile Indicator

This video takes a comprehensive look at the many features and applications of the Profile...

 Watch
Merged and split profiles

This video demonstrates how to use the Profile Indicator to create merged and split profiles as...

 Watch
TPO Profile Playback Demonstration

This video demonstrates how to use the TPO Profile playback feature to quickly jump to the...

 Watch

Pages