-
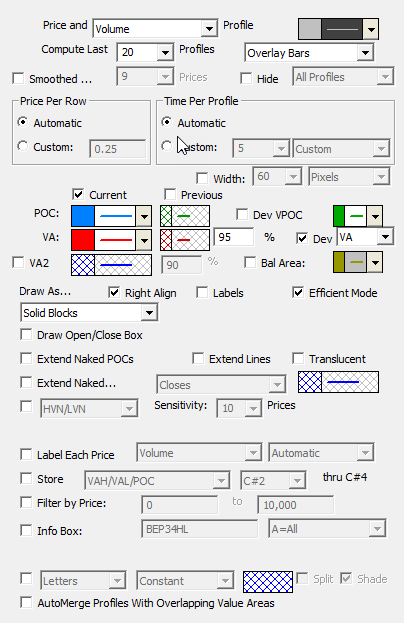
Price and Time/Volume -This option controls whether "time" or "volume" is used when computing the profile(s). If "time" is used, the width of each row in the profile represents the number of bars (over profile period/width) which hit the price range of that row. If "volume" is used, the width of each row represents the volume traded in that rows price range.
-
Hide Profile -If this checkbox is checked, the actual profile itself will not be drawn, allowing the user to draw the VA and POC lines alone.
-
Compute Last ___ Profiles -This option controls how many profiles (sessions) are computed and drawn in the chart. The color control to the right controls the color of the rows outside the value area.
-
Price/Row (Height) -This option controls the "height" of each row of the profile, or the range of prices which each row represents. If a value of 0.04 is specified, for instance, then potential rows would include 0.00 to 0.04, 0.04 to 0.08, ..., 25.08 to 25.12, ..., 100.40 to 100.44, etc. If "Automatic" is selected, Investor/RT will use a reasonable height based on the trading range of the instrument and the timeframe involved.
-
Price/Row (Height) -This option controls the period of time which each profile covers. The "Automatic" option is chosen, a period of "last 100 days" will be used for daily, weekly, and monthly periodicities, while a period of "every 1 day" will be used for intraday periodicities.
-
Current -This checkbox controls whether the current VA and POC lines will be drawn.
-
Previous -This checkbox controls whether the previous VA and POC lines will be drawn.
-
Value Area -This controls the color, style, and width of the current and previous value area lines. The value to the right dictates the % level of the Value Area. The most common value area setting is 70%.
-
Point of Control -This controls the color, style, and width of the current and previous point of control (POC) lines.
-
Dev VPOC/VA/Balance Area/MVP - When these checkboxes are checked, the developing price, such as VPOC is plotted so that the user may see where that price was as of each bar as the profile was "developing". Options to plot the developing VPOC VA,, Balance Area, and MVP. The MVP stands for Mid Volume Price and is the price at which there is an equal amount of volume both above that price and below that price. Balance Area is computed by taking the max of the distance from the VPOC to the high and the VPOC to the low, and adding and subtracting that value from the VPOC to get the Balance Area High and Low.
-
Std Dev Based VA -If this checkbox is checked, the POC will represent the volume/time-based average price, while the VA will be computed using a 70% standard deviation band based off of the average price POC.
-
Label VA and POC -This checkbox controls whether the prices of the VA and POC lines will be labeled.
-
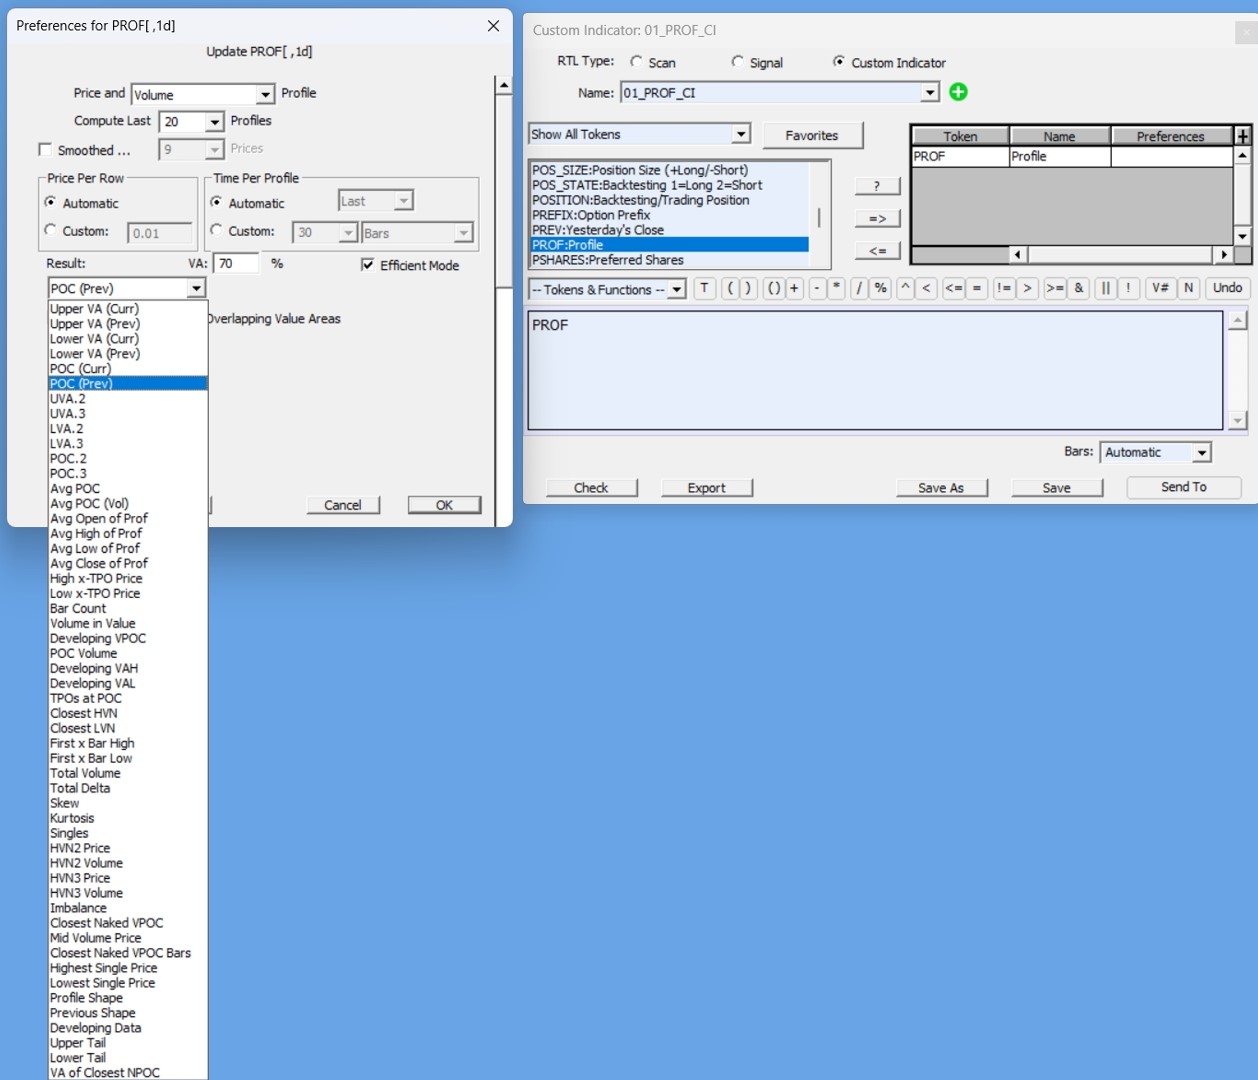
Draw As -This controls the drawing style used to draw the profiles. Choices include "Solid Boxes", "Hollow Boxes", "Solid Ovals", "Hollow Ovals", "Dots", and "Lines". When the PROF token is used in a scan, this control will change to one labeled "Result:" with options of "Upper VA (Curr)", "Upper VA (Prev)", "Lower VA (Curr)", "Lower VA (Prev)", "POC (Curr)", and "POC (Prev)".
-
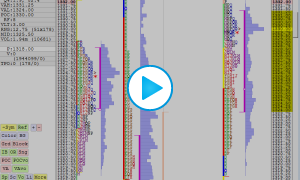
InfoBox -If checked, displays an Info Box containing statistics on each profile. This can also be toggled on/off using the +/- icons on each Profile. For users that do not want to see the +/- icons, go to Setup > Configuration and set the Configuration Variable ProfInfoBoxButton to False.